One in Five: Ending Racial Inequity in Incarceration
One in five Black men born in 2001 is likely to experience imprisonment within their lifetime, a decline from one in three for those born in 1981. Pushback from policymakers threatens further progress in reducing racial inequity in incarceration.
Related to: Racial Justice, Incarceration

Executive Summary
Following a massive, four-decade-long buildup of incarceration disproportionately impacting people of color, a growing reform movement has made important inroads. The 21st century has witnessed progress both in reducing the U.S. prison population and its racial and ethnic disparities. The total prison population has declined by 25% after reaching its peak level in 2009.1 While all major racial and ethnic groups experienced decarceration, the Black prison population has downsized the most. The number of imprisoned Black Americans decreased 39% since its peak in 2002.2 Despite this progress, imprisonment levels remain too high nationwide, particularly for Black Americans.
Reforms to drug law enforcement and to sentencing for drug and property offenses, particularly those impacting urban areas which are disproportionately home to communities of color, have fueled decarceration and narrowed racial disparities.3 These trends have led scholars to declare a “generational shift” in the lifetime likelihood of imprisonment for Black men.4This risk has fallen from a staggering one in three for those born in 1981 to a still troubling one in five for Black men born in 2001.5 Black women have experienced the sharpest decline in their imprisonment rate, falling by 70% between 2000 and 2021.6
But nine years after national protests catapulted the Black Lives Matter movement following the police killing of Michael Brown in Ferguson, Missouri and three years after a national racial reckoning triggered by Minneapolis police officers killing George Floyd, progress in reducing racial disparity in the criminal legal system is incomplete and at risk of stalling or being reversed.
The United States remains fully in the era of mass incarceration. The 25% decline in the total prison population since 2009 follows a nearly 700% buildup in imprisonment since 1972.7 The prison population in 2021 was nearly six times as large as 50 years ago, before the era of mass incarceration, and in 2022 the prison population expanded.8 The prison and jail incarceration rate in the United States remains between five and eight times that of France, Canada, and Germany and imprisonment rates in Arkansas, Louisiana, Mississippi, and Oklahoma are nearly 50% above the national average.9 The reluctance to fully correct sentencing excesses, particularly for violent crimes as supported by criminological evidence, prolongs the harm and futility of mass incarceration.10
Racial equity in incarceration remains elusive. The lifetime likelihood of imprisonment among Black men born in 2001, although decreased, remains four times that of their white counterparts.5 Black women’s rate of imprisonment in 2021 was 1.6 times the rate of white women.12 These disparities are even more pronounced in certain states, and among those serving the longest sentences.13 In 2021, American Indian and Latinx people were imprisoned at 4.2 times and 2.4 times the rate of whites, respectively.14 Fully uprooting these racial and ethnic disparities requires both curbing disparities produced by the criminal legal system and addressing the conditions of socioeconomic inequality that contribute to higher rates of certain violent and property crimes among people of color.
The momentum for continued progress is precarious. Following a dramatic crime drop since the 1990s, the recent uptick in some crime categories—particularly homicides—during the COVID-19 pandemic, as well as the opioid overdose crisis, have led many lawmakers to retreat to the failed punitive policies of the past. A bipartisan backlash to criminal justice reform includes a Congressional proposal to expand mandatory minimum sentences for federal drug offenses and a Congressional resolution overturning Washington, DC’s criminal code overhaul—both without objection from the Democratic president who campaigned on cutting incarceration levels by half.15 This backlash also includes New York’s narrowing of bail reform and Florida’s re-disenfranchisement of people with felony convictions. These efforts impose a double harm on communities of color that are most likely to experience the harms of incarceration, and serious violent victimization which mass incarceration fails to address.
To help protect and expand the progress made so far, The Sentencing Project is producing a series of four reports examining both the narrowing and persistence of racial injustice in the criminal legal system, as well as highlighting promising reforms. This first installment presents an overview of trends in prison and jail incarceration and community supervision. The next installment will examine the high levels of contact that police initiate, particularly with people of color, as well as differential crime rates. The final reports will examine key drivers of disparity from within the criminal legal system and promising reforms from dozens of jurisdictions around the country.
Unfinished Business: Reductions in Incarceration and Disparities
Reforms of the past two decades have reduced both the footprint of the criminal legal system and its racial disparities. But we remain far from ending mass incarceration or its racial and ethnic inequality. As national and local politics resume the politicization of crime and drug policies, it is crucial to take stock of the progress that must be defended and built upon.
Imprisonment: Broad Trends
U.S. prisons held 1.2 million people in 2021, reflecting a 25% reduction from peak year 2009. While notable, this pace of prison downsizing is insufficient in the face of the nearly 700% buildup in imprisonment since 1972.16 The prison population in 2021 was nearly six times as large as 50 years ago, before the era of mass incarceration.17 The prison and jail incarceration rate in the United States remains between five and eight times that of France, Canada, and Germany and imprisonment rates in Mississippi, Louisiana, Arkansas, and Oklahoma are nearly 50% above the national average.18 At the recent pace of decarceration nationwide, it would take 75 years—until 2098—to return to the size of 1972’s prison population.17
Figure 1. Historical and Projected U.S. State and Federal Prison Population Based on 2009-2021 Rate of Decline
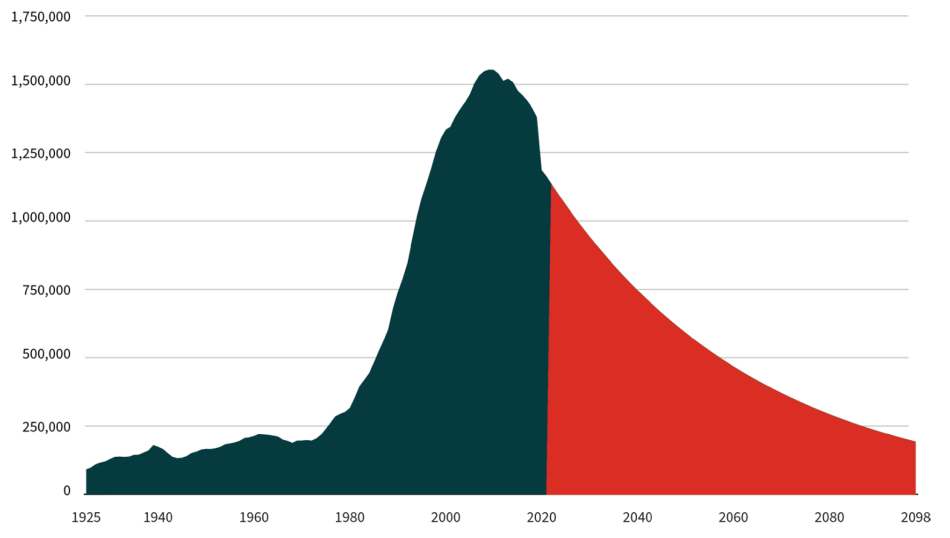
Source of historical figures: Bureau of Justice Statistics. (1982). Prisoners 1925-81; Bureau of Justice Statistics Corrections Statistical Analysis Tool; Carson, E.A. (2022). Prisoners in 2021-Statistical tables. Bureau of Justice Statistics.
Past reforms have helped to reduce the number of people imprisoned for a drug offense by 46% between peak year 2007 and 2020. The number of people imprisoned for a property offense has declined 46% between peak year 2007 and 2020. But for the majority (56%) of the prison population imprisoned for a violent crime—which generally ranges from robbery and assault to rape and murder—sentencing relief remains elusive.20 Overall, the number of people imprisoned for a violent offense has declined by only 10% between peak year 2009 and 2020, despite violent crimes falling by 50% between peak year 1991 and 2020.21 Longer prison terms have prevented this segment of the prison population from contracting amidst a historic crime drop.22
Imprisonment: Racial and Ethnic Disparities
People of color—particularly African Americans—experience imprisonment at a far higher rate than whites. The experience of imprisonment is concentrated among people with lower levels of education, wealth, and income but racial disparities in imprisonment exist across all socioeconomic groups.23 In 2021, Black Americans were imprisoned at 5.0 times the rate of whites, while American Indians and Latinx people were imprisoned at 4.2 times and 2.4 times the white rate, respectively.14 These disparities are even more stark in seven states that imprison their Black residents at over 9 times the rate of their white residents: California, Connecticut, Iowa, Minnesota, New Jersey, Maine, and Wisconsin.25
Figure 2. Imprisonment Rates by Race and Ethnicity, 2021
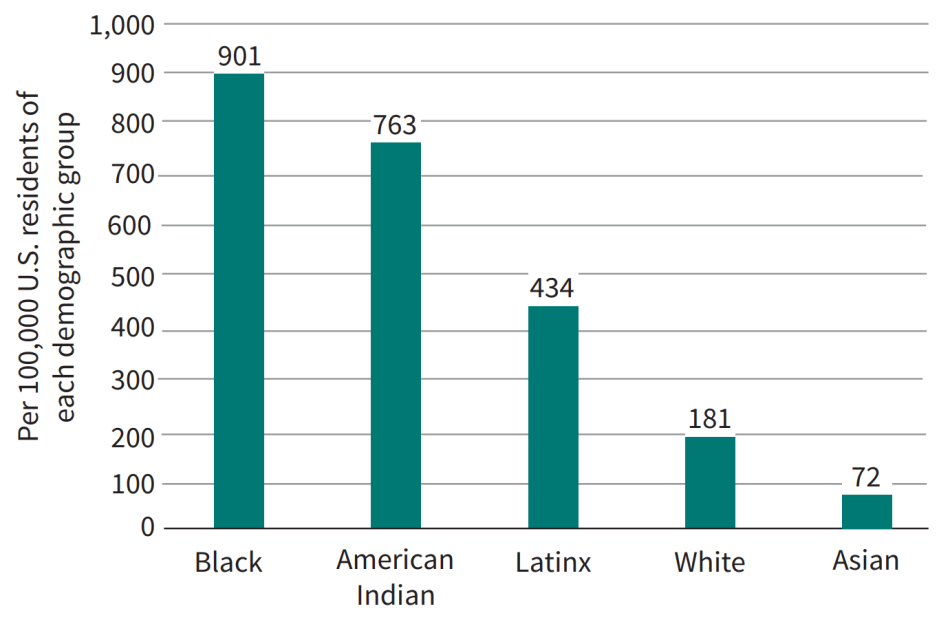
Source: Carson, E. A. (2022). Prisoners in 2021 – Statistical tables. Bureau of Justice Statistics.
These national trends represent both persistent injustices which must be corrected, as well as dramatic progress in the past two decades.26 While all major racial and ethnic groups experienced decarceration since reaching their peak levels, the Black prison population has downsized the most. Reforms to drug-related law enforcement, charging, and sentencing, especially in urban areas which are disproportionately home to communities of color, have helped to drive decarceration for Black Americans.27 While the total U.S. prison population has downsized by 25% since reaching its peak level in 2009, the Black prison population has downsized by 39% since its peak in 2002.28 As shown next, this trend has narrowed, but not eliminated, disparities.
Table 1. Reductions in U.S. Prison Population Since Peak Year
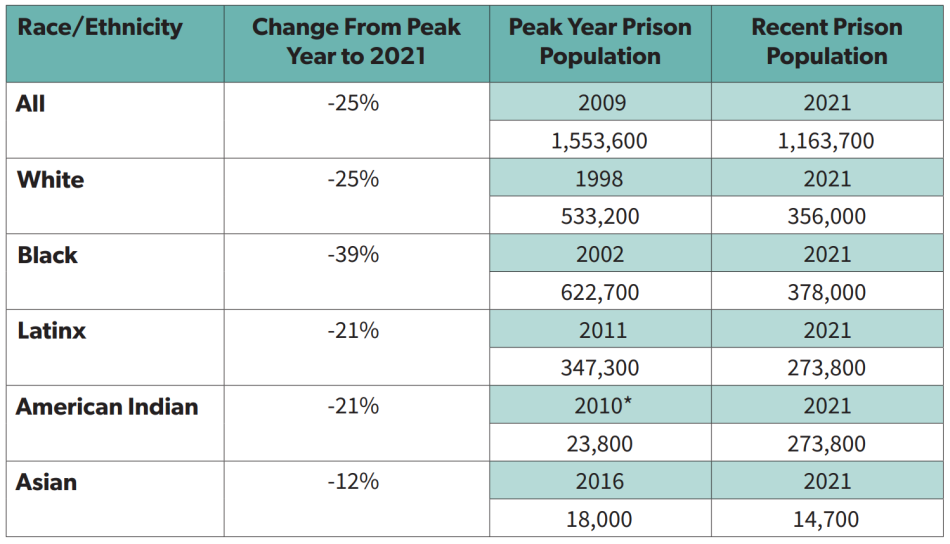
Source: Bureau of Justice Statistics Prisoners Series and Correctional Populations in the United States.
*2010 is the oldest year for which comparable data are available for American Indians and may not represent the peak year.
A similar trend can be seen in imprisonment rates, which represent prison populations as a percentage of the total relevant populations. Looking at imprisonment rates by gender reveals that Black women experienced the most dramatic decline in imprisonment—70%—between 2000 and 2021.29 Still, Black women were imprisoned at 1.6 times the rate of white women in 2021.29
Figure 3. Female Imprisonment Rates: 2000 vs. 2021
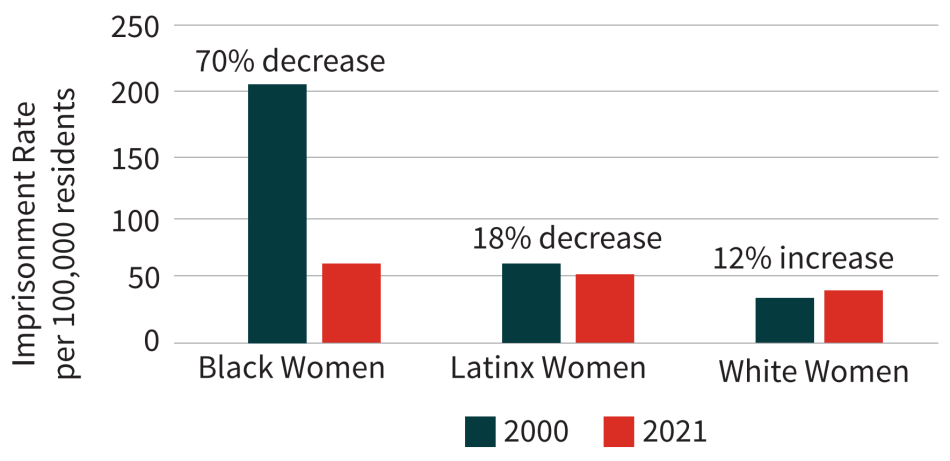
Source: Carson, E. A. (2022). Prisoners in 2021 – Statistical tables. Bureau of Justice Statistics; Beck, A. J., & Harrison, P. M. (2001). Prisoners in 2000. Bureau of Justice Statistics.
Figure 4. Male Imprisonment Rates: 2000 vs. 2021
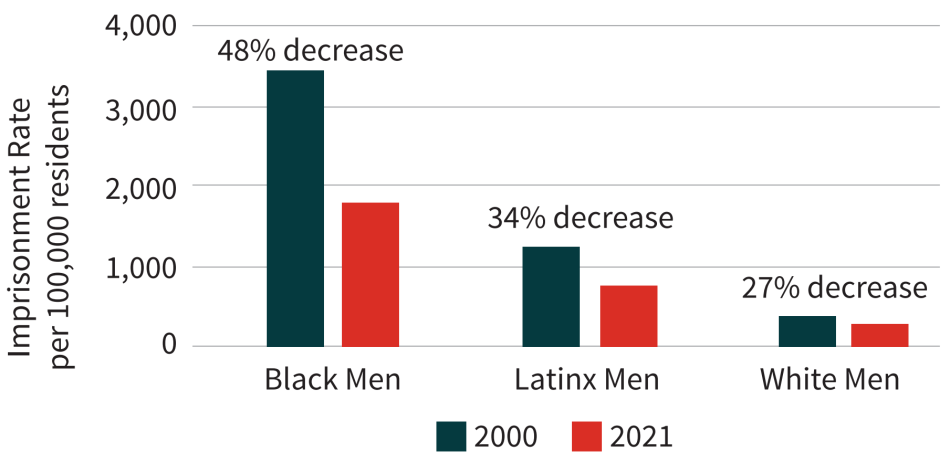
Source: Carson, E. A. (2022). Prisoners in 2021 – Statistical tables. Bureau of Justice Statistics; Beck, A. J., & Harrison, P. M. (2001). Prisoners in 2000. Bureau of Justice Statistics.
The imprisonment rate of Black men also declined substantially, falling by almost half.29 Still, Black men were imprisoned at 5.5 times the rate of white men in 2021.29 Decarceration among Latinx men and women also outpaced that of whites, but Latinx women, and even more so men, remain imprisoned at higher rates than whites.14
Examining the cumulative likelihood of male imprisonment over a lifetime, scholars have highlighted a “generational shift” among Black men.34 For Black men, the lifetime risk of imprisonment fell from 1 in 3 for those born in 1981 to 1 in 5 for those born in 2001.5 This 42% reduction outpaced the 29% reduction in lifetime imprisonment for white men and the 17% reduction for Latinx men. “But several factors caution against being overly sanguine,” the researchers warn, notably the persistence of mass incarceration and its disparities.36 Among those born in 2001, Black men were 4.1 times as likely to be imprisoned within their lifetimes compared to white men, and Latinx men were 2.5 times as likely as white men.
Figure 5. Lifetime Likelihood of Imprisonment of U.S. Males Born in 2001

Source: Robey, J., Massoglia, M., & Light, M. (2023). A generational shift: Race and the declining lifetime risk of imprisonment. Demography, Appendix Table A6.
While these promising trends demonstrate the effectiveness of reforms to narrow racial and ethnic disparities in incarceration, far more work is needed to achieve equity.
Jail Incarceration
Jail populations have also downsized in recent years, with racial disparities decreasing as well. The 636,000 people jailed in 2021 represented a 19% decline from the historic high of 786,000 people jailed in 2008.37 In fact, jail incarceration rates have declined most substantially for non-white populations in the past decade. The decline in the Latinx jail incarceration rate has resulted in this population experiencing a lower jail incarceration rate than whites in 2021 (145 per 100,000 versus 157 per 100,000).
Table 2. Jail Incarceration Rates, Per 100,000 Residents: 2011 vs. 2021
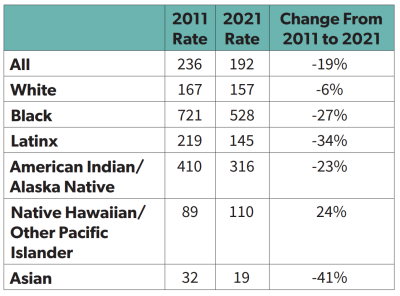
Source: Zeng, Z. (2022). Jail inmates in 2021 – Statistical tables. Bureau of Justice Statistics.
But elevated rates of jail incarceration persist, as do sharp disparities for Black Americans and American Indians compared to whites. This can also be seen best by examining the cumulative lifetime risk of jail incarceration, which is far higher than for prisons since jail incarceration is far more common than imprisonment.38 A study of New York City, which has dramatically reduced its jail incarceration rate, found that 27% of Black men and 16% of Latinx men, in contrast to only 3% of white men, had been in jail by age 38 in 2017.39 Excessively high jail incarceration levels nationwide are especially problematic given that three-quarters of people in jails are unconvicted40—being detained prior to the resolution of their case—and research shows that diverting many people charged with misdemeanor crimes away from jail sentences improves public safety outcomes.41
Community Supervision
The population serving community supervision sentences—probation and parole—has also contracted, reaching 3.7 million in 2021, down from a peak of 5.1 million in 2007.42 The downsizing of this population for whites—a 16% reduction between 2011 and 2021—has been matched or outpaced by all other racial and ethnic groups, except for American Indians, whose population under community supervision has increased 4% during this period.43
While community supervision levels have declined for most racial and ethnic groups, for many of the 3.7 million people on supervision, this sanction serves as a “trip wire for further criminal legal system contact” and is a cause for disenfranchisement in many states.44 In 2021, people of color comprised 62% of the population serving a probation or parole sentence, although they comprised 41% of the U.S. population.45
Youth Incarceration
Youth decarceration has been especially dramatic, and racial and ethnic disparities have declined among this population as well. The number of youth held in juvenile justice facilities fell by 77%—from 109,000 in 2000 to 25,000 in 2020.46 In 2019, Black youth were 4.4 times as likely to be incarcerated in the juvenile justice system as their white peers. This is a decline from the peak level of disparity in 2015, when Black youth were 5.0 times as likely as white youth to be incarcerated. In 2019, Latinx youth were 1.3 times as likely as white youth to be held in juvenile facilities, a decline from a peak level of 2.4 times in 1997.47 American Indian youth, however, were at their peak level of disparity in 2019, having been 3.3 times as likely to be incarcerated as white youth, a level of disparity also reached in 2013.48 In addition to tackling the lingering disparities in youth incarceration, there is need for further decarceration of all youth given evidence that incarceration is often not necessary or effective for youth and well designed alternative-to-incarceration programs produce better public safety outcomes than incarceration.49
Progress is Precarious
Amidst a dramatic crime drop, the United States has made only modest progress in scaling back mass incarceration. Between the mid-1990s and 2019, homicides and other crimes reported to the police plummeted by half.50 But U.S. imprisonment levels continued to increase for nearly two decades while crime rates declined, and decarceration since 2009 (25%) has made only a small dent into the 700% buildup in imprisonment that had occurred since 1972. But recent developments have made even this progress, both in decarceration and in reducing racial disparities, precarious.
In 2020, amidst the COVID-19 pandemic, violent crime rates increased—with homicides spiking—while property crimes continued to decline.51 In 2021, homicides increased again, but at a slower rate and still remained well below the peak levels reached in the early 1990s, while other violent crimes and property crimes decreased overall.52 The homicide rate finally began declining in 2022, but remains above pre-pandemic levels.53 The country has also been grappling with a growing opioid overdose crisis: over a million people have died of drug overdoses since 1999 and over 60% of these overdoses involved opioids.54
Policymakers must now effectively respond to this uptick in lethal violence and overdose deaths through evidence-based responses,55
while correcting the counterproductive, costly, and cruel responses of the past. But instead, many have sought to rollback successful reforms and are reverting to policies from the failed playbook of the past. For example:
- New York
In 2019, legislators here eliminated cash bail for most misdemeanors and nonviolent felonies, along with other changes which reduced pretrial detention.56 But without evidence, critics including New York City’s mayor blamed the reform for the uptick in crime during the pandemic.57 Legislators scaled back the law in iterations, and several Democratic candidates—in both Congressional and state races—lost or struggled among suburban voters over this issue in 2022.58 After initially defending the law, the governor advanced legislation in 2023 to expand the use of bail and increase pretrial detention.59 - Washington, DC
The DC Council unanimously passed an ambitious criminal code reform bill that would have eliminated most mandatory minimum sentences and created a universal opportunity for resentencing after 20 years of imprisonment.60 The bill, however, was vetoed by the mayor and, following the Council’s override, blocked by a bipartisan congressional resolution of disapproval signed by President Joseph Biden.61 DC’s mayor has since encouraged the city’s legislature to increase pretrial detention and called for new mandatory minimums and sentencing “enhancements.” - Florida
Over a million people were expected to regain their voting rights after Floridians overwhelmingly passed Amendment 4 in 2018, allowing most people who had completed their sentences to vote. But the state legislature and governor undid this referendum by conditioning re-enfranchisement on the payment of court-ordered monetary sanctions, effectively re-disenfranchising the majority of those whose voting rights had been restored.62 In another law, the state has violated the Supreme Court’s 2008 ruling against executions for crimes of a sexual nature involving child victims.63 - Nationally
Congress may expand mandatory minimum sentences in response to the opioid overdose crisis. The House of Representatives passed the Halt All Lethal Trafficking of Fentanyl (HALT) Act, which would expand criminal liability and mandatory minimums for offenses involving fentanyl analogues—substances which appear to be chemically similar to fentanyl but which are sometimes harmless.64 Although President Biden campaigned on eliminating mandatory minimum sentences, his administration has not opposed the bill.65
These ineffective approaches to public safety would threaten the progress documented in this report while doing little to advance community safety or address the overdose crisis, while worsening racial disparity in the criminal legal system.
Conclusion
While recent reforms have reduced overall levels of criminal-legal-system contact and its racial and ethnic disparities, we remain fully within the era of mass incarceration. Excessive levels of control and punishment, particularly for people of color, are not advancing community safety goals and are damaging families and communities.66 Consequently, although people of color experience more crime than whites, they are less supportive than whites of punitive crime control policies.67
Ending the injustices described in this report requires uprooting punitive policies and practices that disproportionately impact communities of color, while also reducing excessive punishment for everyone. “The United States would still have an incarceration crisis,” University of Pennsylvania professor Marie Gottschalk has written, “even if it were locking up African Americans at ‘only’ the rate at which whites in the United States are currently incarcerated—or if it were not locking up any African Americans at all.”68
Future installments of this series will highlight reforms that can further reduce the footprint of the criminal legal system and tackle its key drivers of racial disparity: disparate racial impact of laws and policies, racial bias in the discretion of criminal legal professionals, resource allocation decisions that disadvantage low-income people, and policies that exacerbate socioeconomic inequalities.
Research assistance provided by Luke Trinka, Celeste Barry, and Niki Monazzam.
| 1. | Carson, E. A. (2022a). Prisoners in 2021 – Statistical tables. Bureau of Justice Statistics; Carson, E. A. (2012). Prisoners in 2011. Bureau of Justice Statistics. |
|---|---|
| 2. | This report uses the terms Black and African American |
| 3. | Sabol, W. J., & Johnson, T. L. (2022). Justice system disparities: Black-white national imprisonment trends, 2000 to 2020. Council on Criminal Justice; Muhammad, K. G., Western, B., Negussie, Y., & Backes, E. (Eds.) (2022). Reducing racial inequality in crime and justice: science, practice, and policy. National Academies of Sciences, Engineering, and Medicine; Hager, E. (2017, December 15). A mass incarceration mystery. Washington Post. |
| 4. | Robey, J., Massoglia, M., & Light, M. (2023). A generational shift: Race and the declining lifetime risk of imprisonment. Demography, p. 1. https://doi.org/10.1215/00703370-10863378; see also Roehrkasse, A., & Wildeman, C. (2022). Lifetime risk of imprisonment in the United States remains high and starkly unequal. Scientific Advances, 8(48). https://www.science.org/doi/10.1126/sciadv.abo3395 |
| 5. | Robey, Massoglia, & Light (2023), see note 4. |
| 6. | Carson (2022a), see note 1; Beck, A. J., & Harrison, P. M. (2001). Prisoners in 2000. Bureau of Justice Statistics. |
| 7. | Carson (2022a), see note 1; Bureau of Justice Statistics. (1982). Prisoners 1925-81. |
| 8. | Ghandnoosh, N. (2023). Ending 50 years of mass incarceration: Urgent reform needed to protect future generations. The Sentencing Project; Carson, E. A. (2023). Prisons report series: Preliminary data release. Bureau of Justice Statistics. |
| 9. | Carson, E. A. (2022b). Correctional populations in the United States, 2021 – Statistical tables. Bureau of Justice Statistics; World Prison Brief. (2023). Highest to lowest – Prison population total; Widra, E., & Herring, T. (2021). States of incarceration: The global context 2021. Prison Policy Initiative. |
| 10. | Ghandnoosh, N., & Nellis, A. (2023) How many people are spending over a decade in prison? The Sentencing Project. |
| 11. | Robey, Massoglia, & Light (2023), see note 4. |
| 12. | Carson (2022b), see note 9; Beck & Harrison (2001), see note 6. |
| 13. | Nellis, A. (2021). The color of justice: Racial and ethnic disparity in state prisons. The Sentencing Project; Ghandnoosh & Nellis (2023), see note 10. |
| 14. | Carson (2022a), see note 1. |
| 15. | Ghandnoosh, N., & Underwood, B. (2023, January 31). Joe Biden hasn’t kept his promise to reduce the prison population. The Daily Beast. |
| 16. | Carson (2022a), see note 1; Bureau of Justice Statistics (1982), see note 7. |
| 17. | Ghandnoosh (2023), see note 8. |
| 18. | Carson (2022a), see note 1; Carson (2022b), see note 9; World Prison Brief (2023), see note 9. |
| 19. | Ghandnoosh (2023), see note 8. |
| 20. | Ghandnoosh, N. (2019). The next step: Ending excessive punishment for violent crimes. The Sentencing Project; Carson (2022a), see note 1. |
| 21. | Federal Bureau of Investigation. (2023). Crime data explorer. https://cde.ucr.cjis.gov/ |
| 22. | Ghandnoosh & Nellis (2022), see note 10. |
| 23. | Travis, J., Western, B., & Redburn, S. (Eds.) (2014). The growth of incarceration in the United States: Exploring causes and consequences. National Academies of Sciences, Engineering, and Medicine. |
| 24. | Carson (2022a), see note 1. |
| 25. | Nellis (2021), see note 13. |
| 26. | Sabol, W. J., & Johnson, T. L. (2022). Justice system disparities: Black-white national imprisonment trends, 2000 to 2020. Council on Criminal Justice; Sabol, W. J., Johnson, T. L, & Caccavale, A. (2019). Trends in correctional control by race and sex. Council on Criminal Justice; Vera Institute of Justice. Incarceration trends; Muhammad et al. (2022), see note 3. |
| 27. | Sabol & Johnson (2022), see note 3; Muhammad et al. (2022), see note 3; Hager (2017), see note 3. On the changing geography of mass incarceration, see Simes, J. T. (2021). Punishing places: The geography of mass imprisonment. University of California Press. |
| 28. | Carson (2022a), see note 1; Sabol, West., & Cooper (2009), see note 2; Carson (2012), see note 1. |
| 29. | Carson (2022a), see note 1; Beck & Harrison (2001), see note 6. |
| 30. | Carson (2022a), see note 1; Beck & Harrison (2001), see note 6. |
| 31. | Carson (2022a), see note 1; Beck & Harrison (2001), see note 6. |
| 32. | Carson (2022a), see note 1; Beck & Harrison (2001), see note 6. |
| 33. | Carson (2022a), see note 1. |
| 34. | Specifically, this analysis examines experience with imprisonment up to age 50. Robey, Massoglia, & Light (2023), see note 4. |
| 35. | Robey, Massoglia, & Light (2023), see note 4. |
| 36. | Robey, Massoglia, & Light (2023), p. 23, see note 4. |
| 37. | The 2021 jail population increased from 549,000 in 2020, a pandemic-era low. Minton, T. D. (2011). Jail inmates at midyear 2010 – Statistical tables. Bureau of Justice Statistics; Zeng, Z. (2022). Jail inmates in 2021 – Statistical tables. Bureau of Justice Statistics. |
| 38. | The higher likelihood of jail versus prison incarceration is not evident from incarceration rates since these figures are calculated using the population in these facilities at one point in time. Admission and release figures, in contrast, give a better sense of the relative prevalence of these forms of incarceration. An estimated 4.9 million people were admitted to jails in 2017, in contrast to 607,000 people who were admitted to prisons. Jones, A., & Sawyer, W. (2019). Arrest, release, repeat: How police and jails are misused to respond to social problems. Prison Policy Initiative; Carson, E.A., & Bronson, J. (2019). Prisoners in 2017. Bureau of Justice Statistics. |
| 39. | By age 38, about 5% of Black women in New York City had been jailed compared to 2% of Latinx women and less than 1% of white women. Western, B., Davis, J., Ganter, F., & Smith, N. (2021). The cumulative risk of jail incarceration. Proceedings of the National Academy of Sciences, 118, e2023429118. https://doi.org/10.1073/pnas.2023429118 |
| 40. | Zeng (2022), see note 37. |
| 41. | Agan, A. Y., Doleac, J. L., & Harvey, A. (2021). Misdemeanor prosecution. National Bureau of Economic Research. https://doi.org/10.3386/w28600; Vera Institute of Justice. (2021, April 2). What happened when Boston stopped prosecuting nonviolent crimes. |
| 42. | Kaeble, D. (2023). Probation and parole in the United States, 2021. Bureau of Justice Statistics; Oudekerk, B., & Kaeble, D. (2021). Probation and parole in the United States, 2019. Bureau of Justice Statistics. |
| 43. | Kaeble (2023), see note 42. |
| 44. | Lopoo, E., Schiraldi, V., & Ittner, T. (2023). How little supervision can we have? Annual Review of Criminology, 6, p.23. https://doi.org/10.1146/annurev-criminol-030521-102739; Uggen, C., Larson, R., Shannon, S., & Stewart, R. (2022). Locked out 2022: Estimates of people denied voting rights due to a felony conviction. The Sentencing Project. |
| 45. | Kaeble (2022), see note 42; U.S. Census Bureau (2023). QuickFacts. |
| 46. | Rovner, J. (2023). Youth justice by the numbers. The Sentencing Project. |
| 47. | This is the earliest year for which data are available. |
| 48. | Sickmund, M., Sladky, T.J., Puzzanchera, C., & Kang, W. (2022). Easy access to the census of juveniles in residential placement. Office of Juvenile Justice and Delinquency Prevention. |
| 49. | Mendel, R. (2023). Why youth incarceration fails. The Sentencing Project; Mendel, R. (2023). Effective alternatives to youth incarceration. The Sentencing Project. |
| 50. | The homicide rate fell from a high of 9.8 per 100,000 residents in 1991 to 5.1 in 2019 (48% decline); the rate of reported violent crimes fell from 758 per 100,000 residents in 1991 to 381 in 2019 (50% decline); the rate of reported property crimes rate fell from 5,140 per 100,000 residents in 1991 to 2,131 in 2019 (59% decline). Federal Bureau of Investigation (2023), see note 21. |
| 51. | The rate of reported violent crimes increased 5% in 2020 (increasing from 381 to 399 per 100,000 residents). The homicide rate increased 27% in 2020 (increasing from 5.1 to 6.5 per 100,000 residents), following a 2% increase in 2019. Reported rates of property crimes continued their decline in 2020 (falling 8%, from 2,131 to 1,958 per 100,000). Federal Bureau of Investigation (2023), see note 21. See also Grawert, A. and Kim, N. (2022). Myths and realities: Understanding recent trends in violent crime. Brennan Center. |
| 52. | Federal Bureau of Investigation. (2022). The transition to the National Incident-Based Reporting System (NIBRS): A comparison of 2020 and 2021 NIBRS estimates. For preliminary 2022 figures see Rosenfeld, R., Boxerman, B. & Lopez, E. (2022). Pandemic, social unrest, and crime in U.S. cities: Mid-year 2022 update. Council of Criminal Justice. |
| 53. | Rosenfeld, R. Boxerman, B., & Lopez, E. (2023). Pandemic, social unrest, and crime in U.S. cities year-end 2022 update. Council on Criminal Justice. |
| 54. | Mann, B. (2021, December 30). More than a million Americans have died from overdoses during the opioid epidemic. NPR. |
| 55. | Komar, L., & Porter, N. (2023). Ending mass incarceration: Safety beyond sentencing. The Sentencing Project; Mendel, R. (2023). Effective alternatives to youth incarceration. The Sentencing Project; John Jay College Research Advisory Group on Preventing and Reducing Community Violence. (2020). Reducing violence without police: A review of the research evidence. John Jay College of Criminal Justice; Sebastian, T., et al. (2022) A new community safety blueprint: How the federal government can address violence and harm through a public health approach. Brookings; Doleac, J. (2018). New evidence that access to health care reduces crime. Brookings; Ghandnoosh, N. (2017). Opioids: Treating an illness, ending a war. The Sentencing Project. |
| 56. | Misdemeanor convictions are considered less serious than felony convictions and may result in incarceration in jail, rather than prison, for less than one year. Rempel, M., & Lu, C. (2022). The real impact of bail reform in New York state: Two years post implementation. John Jay College of Criminal Justice. |
| 57. | Solomon, J. (2022, Jan. 11). GOP questions state’s bail data; updated data show 2% of bail offenses led to rearrests on violent felonies. Times Union; New York City Comptroller Brad Lander. (2022). NYC bail trends since 2019; Grawert, A., & Kim, N. (2023). The facts on bail reform and crime rates in New York state. Brennan Center for Justice. |
| 58. | Gronewold, A. (2022, Nov. 27). New York Democrats didn’t defend their bail law changes. It bit them at the polls. Politico. |
| 59. | McKinley, J., Ashford, G., & Hurubie, M. (2023, April 28). New York will toughen contentious bail law to give judges more discretion. New York Times. |
| 60. | Ghandnoosh, N. (2023, January 17). D.C.’s criminal code retains significant penalties for violent crime. The Washington Post. |
| 61. | Austermuhle, M. (2023, July 11). Amidst spike in violent crime, D.C. Council approves emergency public safety bill. DCist; Gill, M. (2023, June 26). FAMM’s opposition to B25-291. FAMM. |
| 62. | Porter, N. D., & McLeod, M. (2023). Expanding the vote: State felony disenfranchisement reform, 1997- 2023. The Sentencing Project. |
| 63. | Izaguirre, A. (2023, May 1). DeSantis signs death penalty, crime bills as 2024 run looms. The Associated Press. |
| 64. | H.R. 467 – HALT Fentanyl Act, 118th Congress (2023); Human Rights Watch. (2023). More than 150 groups urge congress to vote no on HALT Fentanyl Act. |
| 65. | Executive Office of the President. (2023, May 22). Statement of administration policy: H.R. 467 – Halt All Lethal Trafficking of (HALT) Fentanyl Act. |
| 66. | See for example: Rios, V. M. (2011). Punished: Policing the lives of Black and Latino boys. New York University Press; Wakefield, S. & Wildeman, C. (2011). Mass imprisonment and racial disparities in childhood behavioral problems. Criminology & Public Policy, 10, 791–817. https://doi.org/10.1111/j.1745-9133.2011.00741.x; Braman, D. (2004). Doing time on the outside: Incarceration and family life in urban America. University of Michigan Press; Western, B. (2002). The impact of incarceration on wage mobility and inequality. American Sociological Review, 67, 526–546. |
| 67. | Ghandnoosh, N. (2014). Race and punishment: Racial perceptions of crime and support for punitive policies. The Sentencing Project; Pfaff, J. F. (forthcoming). The poor reform prosecutor: So far from the state capital, so close to the suburbs. Fordham Urban Law Journal. See also Forman, J. (2017). Locking up our own: Crime and punishment in black America. Farrar, Straus and Giroux. |
| 68. | Gottschalk, M. (2016, January 1). Are we there yet? The promise, perils and politics of penal reform, Prison Legal News. |
interchangeably. Carson (2022a), see note 1; Sabol, W., West, H., & Cooper, M. (2009). Prisoners in 2008. Bureau of Justice Statistics.


