One in Five: Disparities in Crime and Policing
The wide net that police cast across Black communities and other communities of color is at odds with advancing safety.
Related to: Racial Justice

Executive Summary
As noted in the first installment of this One in Five series,1 scholars have declared a “generational shift” in the lifetime likelihood of imprisonment for Black men, from a staggering one in three for those born in 1981 to a still troubling one in five for Black men born in 2001.2
“I can’t breathe,” George Floyd said over 20 times.3 “Every time you see me, you want to mess with me,” said Eric Garner.4 “I just want to go home,” said Tyre Nichols.5 Breonna Taylor asked who had come into her apartment in the middle of the night.6 Police killed them all.7
The Black Lives Matter movement has rightly highlighted the tragic deaths resulting from policing’s biased and excessive contact with people of color. Nearly half of those killed by police in recent years have been Black or Latinx, and officers are rarely held accountable.8
This report interrogates the large footprint of policing—particularly of Black Americans— as, in part, a failed response to racial disparities in serious crimes.9 The wide net that police cast across people of color is at odds with advancing safety because excessive police contact often fails to intercept serious criminal activity and diminishes the perceived legitimacy of law enforcement. Excessive policing also distracts policymakers from making investments to promote community safety without the harms of policing and incarceration. In addition, the large footprint of policing gets in the way of, as the National Academies of Sciences has called for, needed “durable investments in disadvantaged urban neighborhoods that match the persistent and longstanding nature of institutional disinvestment that such neighborhoods have endured over many years.”10
Specifically, this report finds:
- Black Americans were 9.3 times as likely as whites to be homicide victims in 2020, American Indians were 4.3 times as likely, and Latinxs were 1.9 times as likely, based on age-adjusted figures.11 Since homicide is generally an intra-racial crime,12 these figures correspond to higher rates of homicide offending among these communities of color, which is attributable to spatially-concentrated urban poverty resulting from longstanding and ongoing segregation, discrimination, and disinvestment.
- Police officers’ reliance on millions of minor traffic stops annually as a pretext to investigate drivers for criminal activity disproportionately impacts Black and Latinx drivers. Among those they pull over, police are more likely to search Black (6.2%) and Latinx drivers (9.2%) than whites (3.6%).13 But police are often less likely to find drugs or weapons among the Black and Latinx drivers that they search, compared to whites.14
- Black and white Americans use illicit drugs at roughly similar rates, but about one in four people arrested for drug law violations are Black, although Black people make up 14% of the U.S. population.15
Growing protests and calls for change following Floyd’s killing have accelerated reforms in policing and in later stages of the criminal legal system. But there has also been backlash and backsliding. This report identifies several key reforms to right-size policing, as well as resistance to this progress:
- Philadelphia is the first large city to prohibit police from making non-public safety traffic stops and Virginia ended police stops for many common vehicle code violations statewide.16 Cities such as Boston, Denver, Los Angeles, and Seattle have implemented alternative first responder approaches to certain crises as a way to limit the scope of policing and promote deescalation tactics during welfare checks.17 Further, 23 states and the District of Columbia have fully legalized possession of small amounts of marijuana and an additional eight states have decriminalized the drug, leading to a reduction in drug arrests nationwide.18
- Non-carceral approaches to crime include providing universal access to effective drug treatment and investing in community-based violence prevention programs such as Cure Violence, a violence interruption model used in numerous cities including Baltimore, New York City, and Chicago.19 In addition, organizations like the Youth Advocate Program help to bring mentorship and therapeutic support to vulnerable youth across the country.20
- Enacted reforms are promising but precarious. Safety concerns have led many school districts to place officers back on campuses, mounting rates of overdose deaths are impeding efforts to decriminalize drugs, and the pandemic-era uptick in certain crimes and disorder is prompting a return to policing low-level ‘crimes of poverty’ such as loitering, prostitution, and public intoxication. Political fear-mongering, police union lobbying, and misleading media coverage exacerbate this backsliding.
Ending racial inequity in the criminal legal system requires both effectively tackling disparities in serious criminal behavior and eliminating excessive police contact. The subsequent installments of this One in Five series will examine additional drivers of disparity from within the criminal legal system and highlight promising reforms from dozens of jurisdictions around the country.
Racial Disparities in Crime and Victimization: Violent and Property Crimes
Black, Latinx, and American Indian communities are more likely than their white counterparts to experience spatially-concentrated poverty, the result of longstanding and ongoing segregation, discrimination, and disinvestment.21 Experience with socioeconomic disadvantage is common among many people in prisons, where over two-thirds (69%) of the population are people of color.22 In 2016, nearly two-thirds of imprisoned individuals had not completed high school, 17% had spent time in the foster care system, and 14% reported being homeless in the year before their arrest.23 As Thaddeus Johnson and Natasha Johnson of Georgia State University explain:24
Striking racial gaps, rooted in a legacy of structural racism, have left generations of Black people with disproportionately less wealth and education, lower access to health care, less stable housing and differential exposure to environmental harms.
These conditions erode economic and social buffers against crime and contribute to higher rates of certain violent and property crimes—but generally not drug offenses as discussed below—among certain communities of color.
For example, higher rates of geographically concentrated socioeconomic disadvantage contribute to higher rates of certain violent and property crimes among African Americans.25 African Americans represent 14% of the U.S. population.26 But in 2019, this population comprised 36% of arrests for serious violent crimes (51% for murder and nonnegligent manslaughter) and 30% of arrests for property crimes.27 Latinx and American Indian people also experience poverty at higher rates than whites—at 1.9 times and 2.7 times, respectively—and are overrepresented in certain crime categories.28 Comparing arrest data with victimization surveys and self-reports of criminal offending suggests that, especially for certain violent crimes and to a lesser extent for property crimes, higher arrests rates among people of color correspond to higher rates of criminal offending.29
FIGURE 1: Homicide Victimization Rates by Race and Ethnicity
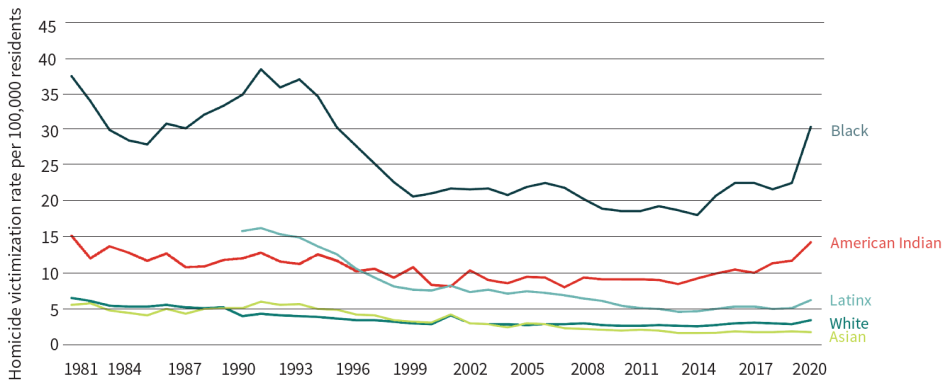
Note: Age-adjusted figures; pre-1990 data do not separate Latinxs from other racial categories
Source: Centers for Disease Control and Prevention. Fatal injury and violence data.
Black, American Indian, and Latinx people are also more likely than whites to be victims of property and serious violent crimes.30 This is especially clear with homicides: Black Americans were 9.3 times as likely as whites to be homicide victims in 2020, American Indians were 4.3 times as likely, and Latinxs were 1.9 times as likely, based on age-adjusted figures.31
Since homicide is largely an intra-racial crime, meaning that people generally kill others of the same race or ethnicity,32 these figures correspond to higher rates of homicide offending among these communities of color.
These disparities in criminal offending contribute to disparities in imprisonment, but do not fully explain it. Several flagship studies have tied some of the disparity in the prison population to disparities in arrest rates. Criminologists Alfred Blumstein and Allen Beck have concluded that in various time periods, higher rates of arrest explain between 70% and 80% of Black overrepresentation in prisons.33 They found a higher correspondence between arrest and imprisonment disparities for the most serious crimes, and less for less serious crimes. The weaker correspondence between arrest and imprisonment disparities for less serious crimes is especially troubling given that, as discussed next, people of color’s higher rate of arrests for these crimes often does not reflect a higher rate of criminal offending. Racial differences in serious criminal offending, however, contribute to racial differences in the prison population. Only effective interventions beyond policing and prisons—those that address the higher rates of geographically concentrated socioeconomic disadvantage in high-violence communities—can tackle this source of disparity.
Tackling Racial Disparities in Crime and Victimization
Fully eliminating racial disparities in crime rates requires making, as the National Academies of Sciences has explained, “durable investments in disadvantaged urban neighborhoods that match the persistent and longstanding nature of institutional disinvestment that such neighborhoods have endured over many years.”34 A growing body of research can also guide policymakers to identify near-term interventions to promote community safety without the harms of policing and prisons, as discussed next.
The Brookings Institute as well as John Jay College of Criminal Justice have created syntheses of research evidence on public health approaches to crime as guides for funding organizations, community leaders, and lawmakers.35 Two reports from The Sentencing Project also highlight non-carceral social interventions for youth and adults to promote community safety.36 These policies include providing universal access to effective drug treatment, investing in community-based violence prevention programs, reimagining crisis response, and expanding mentorship and therapeutic support for youth. Efforts to implement these strategies are well under way and have been met with much success. Cure Violence has worked with cities most impacted by violent crime to positively engage those at high risk for violence and work to change community norms.37 In addition, as of 2023, the Youth Advocate Program model is providing mentorship and other therapeutic resources to over 17,000 families across 35 states and the District of Columbia.38
In some cases, police associations have supported effective crime-prevention policies. For example, the International Association of Chiefs of Police has supported several measures to prevent gun violence,39 and the Los Angeles Police Department’s union supported transferring certain service calls to other city agencies.40 But rather than dramatically increase investments in communities impacted by violence and in non-carceral social interventions, many policymakers continue to support intensive drug law enforcement and police-initiated contact through traffic stops, which recent reforms have begun to challenge.
Racial Disparities Produced by Policing
A. Drug Enforcement
In contrast to rates of serious violent offending, surveys by federal agencies show that both recently and historically, whites, Blacks, and Latinxs have used illicit drugs at roughly similar rates, though American Indians have done so at comparatively higher rates.41 Many studies also suggest that people who use drugs generally purchase drugs from people of their own race or ethnicity.42
FIGURE 2: Illicit Drug Use in Past Month Among People Age 18 or Older, 2021
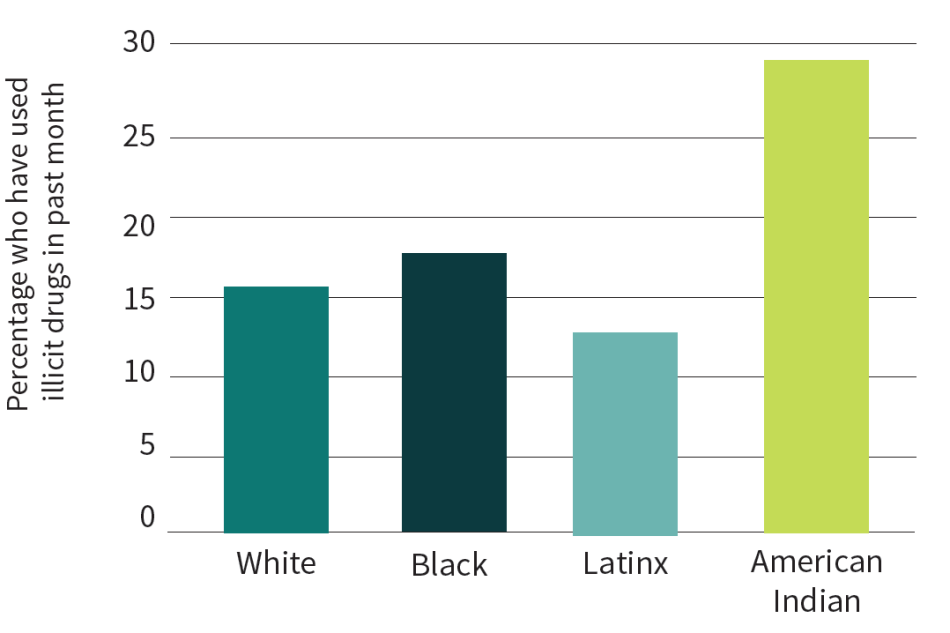
Source: Substance Abuse and Mental Health Services Administration. (2022). Results from the 2021 National Survey on Drug Use and Health: Detailed tables.
Racially disparate policies and bias largely drive racial and ethnic disparities in drug arrests and incarceration. In 2019, police officers made over one million drug arrests, with 29% being for marijuana possession.43 Over one in four people arrested for drug law violations were Black, although Black people make up 14% of the U.S. population and drug use rates do not substantially differ by race and ethnicity.44
Looking specifically at marijuana possession arrests, the ACLU found that Black Americans were 3.6 times as likely as whites to be arrested for this offense in 2018, even though Black Americans used marijuana at 1.2 times the rate of whites.45
FIGURE 3: Racial Disparities in Marijuana Use in Past Month and Marijuana Possession Arrest Rates, 2018
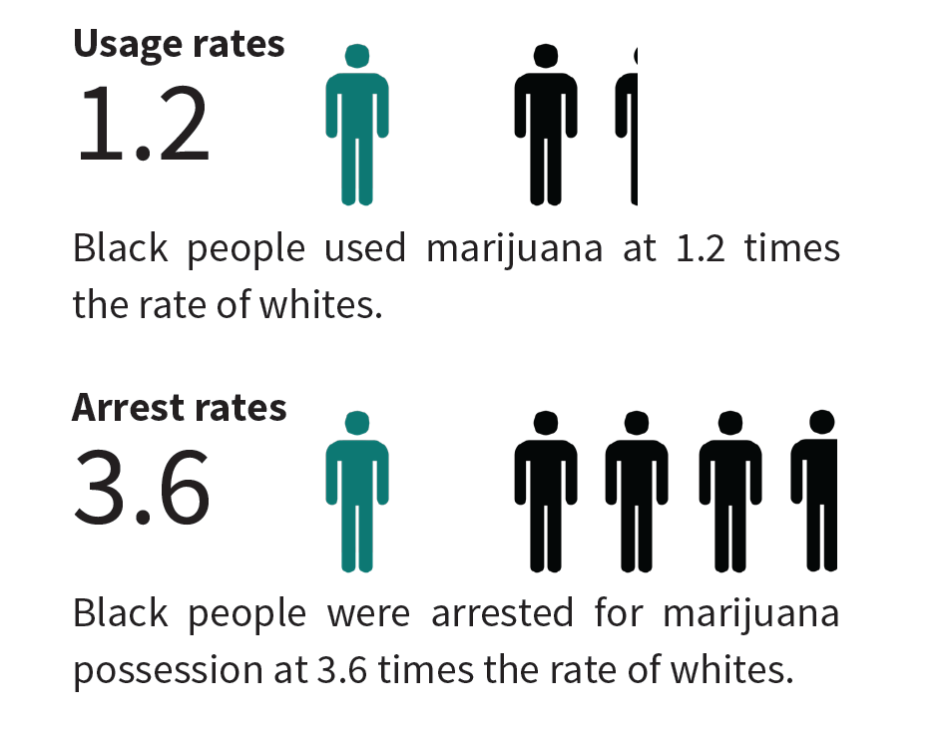
Source: Substance Abuse and Mental Health Service Administration. (2019). Results from the 2018 National Survey on Drug Use and Health: Detailed tables; Edwards, E., Madubuonwu, B., & Greytak, E. (2020). A tale of two countries: Racially targeted arrests in the era of marijuana reform. American Civil Liberties Union.
These disparities widen at later stages of the criminal legal system such that 62% of people in state prisons for drug offenses are people of color, even though people of color comprise 41% of the U.S. population.46
B. Traffic Stops, Pedestrian Stops, and School Policing
Policing policies that cast a wide net for neighborhoods and on populations associated with high crime rates disproportionately affect people of color. Consequently, people of color are more likely to be arrested even for conduct that they do not engage in at higher rates than whites, as previously noted with drug offenses, and as discussed below regarding traffic stops, pedestrian stops, and with policing in schools. These forms of policing produce a high prevalence of arrests with uneven distribution. By age 23, 49% of African American men had been arrested, in contrast to 38% of white men, based on a 2014 study.47 These racial and ethnic disparities in police contact snowball as individuals traverse the criminal legal system. They also, as discussed below, reduce the perceived legitimacy of policing.
Traffic Stops
In 2018, police officers initiated contact with nearly 29 million U.S. residents aged 16 and older: traffic stops comprise over four-fifths of police-initiated contact.48 There are clear racial disparities in traffic law enforcement. For example, the Stanford Open Policing Project’s dataset of nearly 100 million stops collected from 21 state patrol agencies and 35 municipal police departments reveals that these agencies were more likely to stop Black, but not Latinx, versus white drivers between 2011 and 2018.49 Echoing findings from other ‘veil of darkness’ analyses, this study also found that officers stopped Black drivers less often after sunset, when a driver’s racial identity is less visible.50 Studies of jurisdictions including Connecticut, Massachusetts, North Carolina, and South Carolina have also found significant racial disparities in police stops.51 On the other hand, national surveys of drivers since 2002 have found racial disparities in traffic stops only in some years.52 But a closer look at the causes of traffic stops reveals that officers stop Black drivers for less serious reasons than white drivers.
Charles Epp of University of Kansas and his colleagues have shed light on investigatory traffic stops. These are distinct from traffic-safety stops, which are based on factors such as speeding at greater than seven miles per hour, suspicion of driving under the influence of drugs or alcohol, running a red light, or reckless driving. The pretext for investigatory stops, on the other hand, may be for such infractions as failure to signal a turn or lane change, having a malfunctioning light or expired license tag, driving too slowly, or stopping too long—or for the officer to check for a valid license or to conduct a warrant check. The objective of these stops is to investigate drivers deemed suspicious. This is a form of proactive policing that uses minor traffic violations as a pretext for a criminal investigation and helps raise municipal revenues through fines and fees.53 Traffic-safety stops, the researchers found, are based on “how people drive,” whereas investigatory stops are based on “how they look.”54
Epp and colleagues’ study of police stops between 2003 and 2004 in Kansas City found that investigatory stops differed significantly by race while rates of traffic-safety stops did not.55 These differences existed for all ages, however, they were sharpest among drivers under age 25: among these drivers, 28% of Black men had experienced an investigatory stop as had 17% of Black women, compared to 13% of white men and 7% of white women. Socioeconomic differences did not fully explain this racial disparity: Black drivers under age 40 were over twice as likely as their white counterparts to experience investigatory stops for both the highest- and lowest-valued cars. More recently, University of North Carolina professor Frank R. Baumgartner and colleagues analyzed over 20 million stops in North Carolina between 2002 and 2016 and found that the majority of stops that white drivers experienced (56%) were for traffic safety reasons, while the majority of stops that Black drivers experienced (52%) were for investigatory reasons.56 Directing officers to make investigatory stops, Epp and colleagues argue, opens the door to biased policing based on stereotypes of Black criminality.
Pedestrian Stops and Order-Maintenance Policing
Similar disparities arise in investigative pedestrian stops and with order-maintenance policing. In 2013, Judge Shira A. Scheindlin concluded, regarding New York City’s stop-and-frisk tactic, that the city’s “highest officials have turned a blind eye to the evidence that officers are conducting stops in a racially discriminatory manner.”57 The police policy broadly targets male residents of neighborhoods populated by low-income people of color to uncover drugs and weapons. Despite evidence finding the tactic to be ineffective, a conclusion that was reinforced when New York City continued its crime decline after scaling back stop and frisk, related forms of policing persist in many other cities.58 For example, a 2022 analysis of the Milwaukee Police Department’s stop-and-frisk practices, conducted by the Crime and Justice Institute, found that Black residents were 4.5 times as likely to get pulled over, 10.1 times as likely to be subjected to a field interview, and 2.6 times as likely to be frisked as white residents.59
Further, in 2022, New York City Mayor Eric Adams re-embraced ‘broken windows’ policing, a policy seeking to promote public safety by clamping down on petty, ‘quality-of-life’ offenses and disorder through arrests.60 Order-maintenance policing persists despite the limited evidence to support its efficacy and great cause for concern about its negative impact, disproportionately on people of color.61
Stop Outcomes: Searches, Arrests, and Police Violence
National surveys, as well as studies of specific jurisdictions, reveal disparities in the outcomes of police stops. After pulling a driver over for a traffic stop in 2018, officers nationwide searched Black and Latinx drivers 1.7 and 2.6 times as often as whites, respectively.62 This disparity holds even though police are less likely to find illegal drugs, weapons, or other forms of contraband such as stolen goods in the cars of Black and Latinx drivers than those of whites.63 These patterns of ‘contraband hit rates’ have been found in jurisdictions across the country, including Philadelphia, Missouri, and California.64 Because they are searched so much more frequently, Black and Latinx drivers are arrested more frequently than whites in police stops—a disparity that would be reduced if they were searched at the same rate as whites.65
Police violence also differs by race. In recent years, police officers have threatened or used non-fatal force in about 3% of encounters that they initiated or which resulted from a traffic accident.66 But they have been over 2.5 times as likely to use or threaten force against Black individuals as whites (5.5% versus 2.1% in 2020) and more likely to do so against Latinx individuals (3.4%) than whites as well.67 Researchers have also identified racial disparities in how respectfully police officers speak to stopped drivers, based on body-worn camera footage from Oakland, CA.68
Racial disparities are also stark in relation to who police officers kill. Black Americans were 2.5 times as likely to be shot and killed by police officers as whites, and Latinx people were 1.2 times as likely, between 2015 and 2021.69 At this rate, police will kill an estimated one in 1,000 Black men.70 Police officers’ greater inclination to stop and search people of color suggests that differences in people’s behavior alone are unlikely to account for disparities in lethal police violence.
Police in Schools
As a result of zero-tolerance disciplinary policies and over-policing in schools generally, schools have long been an onramp to formal criminal legal involvement for youth who misbehave. There is compelling evidence that the presence of police officers in schools—usually known as ‘school resource officers’—tends to increase the number of youth arrested at school. The majority of arrests by these officers are for low-level misdemeanors, such as disorderly conduct or simple assault (e.g., schoolyard fighting). The racial disparities for these kinds of arrests are significant, and research makes clear that getting arrested decreases the likelihood of completing high school and increases the likelihood of future justice system involvement.71
A 2014 investigation of disparities in school discipline—including rates of out-of-school suspensions and police referrals—led the Departments of Education and Justice to acknowledge that the substantial racial disparities in school discipline “are not explained by more frequent or more serious misbehavior by students of color,” but likely stem from racial bias.72
Impacts of Racially Disparate Policing
These wide-ranging and targeted encounters erode public confidence in law enforcement. In 2020, Black and Latinx people nationwide were far more likely than whites to report believing that the police behaved improperly during a police stop.73 Young people of color who experienced investigatory stops and searches in St. Louis and New York City reported that they were stopped with insufficient evidence and that police relied excessively on violence or its threat, diminishing their perception of the legitimacy of law enforcement.74 In national surveys, a majority of whites report having confidence in the police or believing that police use the right amount of force, but only a minority of Black people agree.75
The tensions resulting from excessive, intrusive, and violent police encounters diminish the ability of police to gain the cooperation that they need to identify crime suspects, and can contribute to retaliatory violence in communities. Frayed police-community relationships contribute to lower homicide clearance rates, and cases involving Black and Latinx versus white victims bear the brunt of this impact.76 Police officers have, to differing degrees, become aware of the problem: a 2016 Pew Research Center survey of police officers found only 60% of white and Latinx officers and 32% of Black officers characterized police relations with Black residents as excellent or good.77 Nonetheless, evidence suggests that in many jurisdictions, police see intensive and disproportionate levels of contact with people of color as helping to reduce crime, even though these policies have produced little community safety benefit but huge human costs.78
High-profile killings by police officers—such as those of Freddie Gray, Breonna Taylor, Michael Brown, George Floyd, and Eric Garner—have illustrated some of the problematic rationales underlying excessive police-initiated contact with people of color: to fight the War on Drugs, to raise municipal revenues through ticketing, or to prevent violent crime via the debunked broken windows policing theory.79 For example, in Ferguson, Missouri, where police killed Michael Brown, the Justice Department found that “law enforcement practices are shaped by the City’s focus on revenue rather than by public safety needs.”80 As discussed next, several jurisdictions have begun to reject this faulty logic and to reduce unnecessary and harmful police contact with the community.
Right-Sizing Policing and Increasing Accountability
To reduce the scale of police contact and the negative consequences that disproportionately ensue for people of color, several jurisdictions have worked to limit police intervention for nonviolent offenses on the roads, streets, and in schools, as well as to develop policies that increase police accountability. This has been accomplished through drug legalization and decriminalization policies, reduced enforcement of low level-crimes and traffic violations, and investments in crisis-response alternatives. Police departments are also making efforts to improve code-of-conduct standards, bolster duty-to-intervene policies, and increase diversity among officers. Law enforcement agencies have also pursued implicit bias training and body-worn cameras—initiatives that have not yet had the desired impact, as discussed below.
A. Reducing the Scope of Police-Initiated Contact
Decriminalizing and Legalizing Drug Use
As of October 2023, 31 states and the District of Columbia have decriminalized possession of small amounts of marijuana. Twenty-four of those jurisdictions have taken the next step and fully legalized the drug for adult recreational use.81 These efforts have helped reduce the number of people arrested for marijuana possession from a peak level of 585,000 in 2009 to 377,000 in 2019. Still, 29% of drug arrests in the United States in 2019 were for marijuana possession, reflecting the need for greater adoption of legalization and decriminalization laws.82
Limiting Police-Intervention in Minor Traffic Infractions
State and city lawmakers as well as local prosecutors are reducing police enforcement of minor traffic violations, which are often used as a pretext for criminal investigation and can become fatal for drivers. In 2021, Philadelphia passed the Driving Equality Act and became the first major city to prohibit police from making non-public safety traffic stops—such as for driving with a broken taillight or with a registration plate that is not clearly displayed.83 Philadelphia’s police may now only pull a driver over and ticket them if they have committed a “primary violation,” such as dangerous driving.84 Enforcement of minor traffic violations will fall upon unarmed, trained members of the city’s transportation department.85 In 2021, Virginia enacted a law that limits police from stopping drivers for vehicle code violations such as defective tail lights, dark window tint, or objects dangling from the rearview mirror.86 Police may only stop or arrest a driver if they have committed a more serious offense, such as speeding or reckless driving.87 Virginia’s reform resulted in a significant reduction in the number of Black drivers stopped and searched.88 Though efforts from police unions to overturn Philadeliphia’s reforms were rejected by the courts,89 Virginia’s reforms remain under threat and are up for potential repeal by the state legislature in 2024.90 Minneapolis, Memphis, TN, Berkeley, CA, Ann Arbor, MI and Fayetteville, NC, have made similar efforts to limit enforcement of minor traffic stops.91
In the absence of state or citywide reforms to non-public safety traffic stops, some prosecutors have acted to change the incentives and outcomes of policing. In Minnesota, the Ramsey County Attorney John Choi, in collaboration with the Saint Paul Police Department and the Ramsey County Public Defender’s Office, adopted a policy of declining to file possession-of-contraband charges in cases where an officer searched a motorist after stopping them for a minor traffic infraction.92 Similarly, in Vermont, Chittenden County State’s Attorney Sarah George declared that her office would decline to prosecute cases in which evidence was obtained during traffic law violations that did not endanger others.93
Limiting Investigative Pedestrian Stops
Investigative pedestrian stops remain a vital issue in need of reform and some progress has been made to limit stop-and-frisk policies in the last decade. In 2013, Judge Shira A. Scheindlin declared New York City’s investigative pedestrian stops discriminatory and unconstitutional in response to a federal class action lawsuit filed by the Center for Constitutional Rights.94 In the decade since this ruling, the city’s number of annual stop-and-frisks recorded fell from over 500,000 stops in 2012 to just over 15,000 in 2022.95 As racial discrimination and unchecked police authority remain an issue across investigatory stops, the ACLU continues to play a leading role in fighting renewed calls for adoption of stop-and-frisk policies in cities across the country.96
Removing Police from School Disciplinary Procedures
Several school districts have enacted new school disciplinary policies to reduce racial disparities in out-of-school-suspensions and police referrals. In 2021, Los Angeles schools nearly eliminated police-issued truancy tickets and redirected their reliance on police officers to fund the hiring of counselors, nurses, and restorative justice practitioners.97 Since the creation of the Philadelphia Police School Diversion Program in 2014, students with no prior criminal history who have been arrested for misdemeanors are not charged with a criminal offense. Instead, they are directed into a diversion program. As a result, there has been a major drop in arrests in the city’s schools.98
In the years following George Floyd’s 2020 murder, calls for similar police reforms and racial justice in schools expanded. Many school districts joined in taking a closer look at their policing practices, with 55 districts moving to eliminate school resource officers from their schools.99 As discussed later, some of these reforms have unfortunately not been sustained.
Investing in Crisis-Response Alternatives
In response to the high levels of police contact among people with mental illness,100 the federal government has devoted $1 billion over 10 years for states that set up co-responder and alternative first responder approaches to incidents involving mental illness, substance use problems, or homelessness.101 Co-responder models pair officers with unarmed community responders, whereas alternative first responder models remove law enforcement from the first response altogether.102 Exemplifying the latter is the Crisis Assistance Helping Out On The Streets (CAHOOTS) program implemented in Eugene, Oregon. CAHOOTS dispatches mental health professionals to 20% of 911 calls which are related to welfare checks, mental health episodes, public intoxication, or death notices.103 New Jersey and cities such as Albuquerque, NM, Ann Arbor, MI, Boston, Denver, Los Angeles, and Olympia, WA, have piloted similar initiatives.104
Other cities have implemented programs that limit reliance on criminal punishment. In 2011, Seattle introduced the first Law Enforcement Assisted Diversion (LEAD) program, a community-based diversion approach for responding to low-level criminal offenses like illicit drug possession or sex work. Instead of entering the criminal legal system, diverted individuals receive supportive services including housing and substance use treatment. Recognizing its success, communities across 21 states are implementing the program.105 In recent years, the LEAD model has come under increased scrutiny for centering police in the provision of social services.106
B. Increasing Police Accountability
Reducing Use of Force and Bolstering Intervention and Oversight Policies
Reckoning with the too often violent and racially discriminatory interactions across traffic and pedestrian stops, cities have begun to revisit the considerable leeway provided to police on when to use force. Given the “objectively reasonable” standard created by the Supreme Court,107 states and local police departments have restricted or provided guidelines on when certain types of force can be used.108 In addition, most of the nation’s largest police departments have adopted duty-to-intervene policies, to prompt officers to act when they witness inappropriate or unlawful behavior from colleagues.109 Both Colorado and Washington State impose criminal liability or mandatory decertification for officers who fail in their obligation to intervene in or to report such instances.110 Organizations such as the ACLU have also identified several structural barriers that need to be addressed to make civilian oversight effective.111
The federal government has stepped in to curb abuses in policing. The Department of Justice investigated 69 local police departments between 1994 to 2017, entering into consent decrees or memoranda of understanding with 40 cities across the country to reduce excessive force and/or to protect civil rights. Consent decrees have generally led to improved outcomes, though some police departments struggle to sustain reforms.112
Bringing Justice to Police Misconduct
Several jurisdictions are also increasing accountability for misconduct and crime, often amidst fierce opposition from police unions.113 Massachusetts decertifies officers for misconduct, which includes making false arrests or using excessive force that results in death or serious bodily injury.114 Connecticut, Maryland, and Wisconsin have passed laws requiring special prosecutors to handle cases of police misconduct in order to address the potential conflict of interest with local district attorneys.115 Colorado restricted qualified immunity in 2020, increasing liability for officers who violate constitutional rights, and requiring that local governments ensure that people whose rights have been violated by police will be compensated.116 The federal George Floyd Justice in Policing Act, whose reforms included restricting qualified immunity and creating a national police misconduct registry, passed in the House in 2021 but failed in the Senate.117 Police unions and the International Association of the Chiefs of Police fiercely opposed several key provisions, including restricting qualified immunity and permitting use of force only when necessary.118
Diversity in Policing
Although most police departments are less diverse than the populations they serve, many urban areas have narrowed this gap. A diverse police force alone will not remedy abusive policing, yet some recent studies suggest that increasing the representation of officers of color reduces stops, arrests, and police violence against Black Americans.119 Some of the country’s largest police departments, including New York City, Los Angeles, Chicago, and Dallas have worked to diversify their police forces, gaining more Black, Latinx, and Asian officers, as well as police chiefs of color.120 In departments that served one million people or more in 2020, 47% of officers were white, 30% were Latinx, and 16% were Black. Diversity is far more limited at the national level where 69% of officers are white, 14% are Latinx, and 12% are Black. Similarly, 53% of police chiefs in departments serving 250,000 or more residents are people of color, but this figure falls to 13% among police chiefs nationwide.121 While increasing the representation of communities of color among criminal legal professionals is necessary, it is insufficient for ending injustice. As the Center for Policing Equity has noted, “Law enforcement policies, procedures, and culture…are shaped by White supremacy. Any [police] officer working in such a system risks finding themselves engaged in behavior that is racist in nature, even if they do not, personally, hold racist beliefs or are themselves, Black.”122
Interventions with Limited Impact on Excessive and Disparate Policing: Implicit Bias Training and Body-Worn Cameras
Many police departments have responded to calls for justice in policing by implementing implicit bias training and expanding the use of body cameras. There is value to these reforms, yet evidence does not support their ability to successfully and adequately address the root causes of bias and discrimination that pollute police departments and policing policies.
Implicit bias training raises awareness of bias and seeks to minimize its impact. But analyses of police departments’ implementation of these trainings for their officers show a considerable variance in quality and their effect on officer behavior is unclear.123 Jennifer Eberhardt, professor of psychology at Stanford University, advises that organizations offering anti-bias training must avoid “moral credentialing,” wherein completion of training is used to dismiss concerns about problematic behavior and policies.124 Such training could, she warned, displace the hard work of mitigating the impact of bias through monitoring and addressing the cultural practices and policies that produce inequities.
Similarly, research has found limited impact from the use of body cameras worn by officers to reduce their excessive use of force.125 A study of the New York City Police Department’s use of body-worn cameras identified an increase in the legitimacy of police stops, decrease in complaints filed against officers, as well as a reduction in arrests. However, body-worn cameras remain an unproven and insufficient defense against police use of force and must be accompanied by more robust reforms to code-of-conduct policies.126
Progress is Precarious
Amidst concerns surrounding an uptick in certain crimes in the first years of the pandemic and the continued overdose crisis, the promise of progress brought by reforms is in jeopardy. Political fear-mongering, police union lobbying, and misleading media coverage are fueling efforts to resist and rollback reforms:
- Police unions play a significant role in shaping criminal law and expanding its reach as they collectively bargain, lobby, litigate, engage in public advocacy, and adjust their policies and practices to maintain punitive laws and resist reforms that would advance racial equity and increase police accountability.127 For example, police unions helped quash dozens of qualified immunity bills that arose following the murder of George Floyd and continue to lobby for the dismantling of similar policies across the country.128
- Criminal legal practitioners are undoing some reforms aimed at curbing low-level arrests and policing. In Baltimore, the new State’s Attorney, Ivan Bates, has reversed his predecessor’s policy that authorized prosecutors to decline to prosecute non-violent, low-level arrests, despite the policy’s success in decreasing arrest rates and racial disparities without increasing crime.129 Police officers will now levy citations for offenses such as dirt bike riding, loitering, panhandling, public intoxication, and simple drug possession.130 Several studies have found that charging individuals for non-violent misdemeanors increases their likelihood for future offending.131
- Lawmakers are also rethinking legislation that decriminalizes drugs and prioritizes non-punitive strategies to address the opioid crisis. In Oregon, struggles to combat the fentanyl overdoses and difficulties implementing Measure 110, a law that decriminalized the possession of controlled substances and looked to provide public health resources for those struggling with substance use, has led to calls for this law to be repealed.132 Rather than rejecting such reforms altogether, lawmakers could help ensure their success by developing realistic implementation steps that sufficiently resource public health promises such as access to drug treatment, housing assistance, and other behavioral health resources.133
- School districts around the country have reintroduced police presence in schools. In the years following George Floyd’s 2020 murder, 55 districts moved to eliminate school resource officers (SROs) from their schools.134 However, high-profile school shootings, as well as concerns about youth crime have led many districts to begin to reverse this reform.135 By July 2022, eight districts, including Pomona, CA, Alexandria, VA, and Montgomery County, MD had returned officers to schools.136 Police officers may make some students, parents, and staff feel safer, yet evidence confirms SROs increase and escalate disciplinary practices, levied most harshly on Black students, without preventing gun-related incidents.137
Given the integral role of misleading news coverage in the 50-year history of mass incarceration, more accurate and holistic media coverage of crime and justice policies is critical for preventing this backsliding.138
Conclusion
This report takes a close look at policing policies and practices resulting in excessive contact with people of color, especially Black Americans. A high volume of police contact fails to address the higher rates of serious violent offending and victimization among communities of color, and sometimes exacerbates these problems. To meaningfully tackle serious crime, policymakers need to make meaningful investments in interventions outside of policing, and end the harms of excessive police contact.
In subsequent installments, this series will present a framework for understanding four key drivers of racial disparities within the criminal legal system: 1) The disparate racial impact of laws and policies; 2) Racial bias in the discretion of criminal legal professionals; 3) Policies and decisions that disadvantage low-income people, and; 4) Policies that exacerbate socioeconomic inequalities. These reports will also highlight promising reforms that dismantle these inequities.
This report was written by Nazgol Ghandnoosh and Celeste Barry. Research assistance provided by Luke Trinka, Kevin Muhitch, and Niki Monazzam. The authors are grateful to Kristen Budd, Kara Gotsch, Florence Lee, Ashley Nellis, Nicole Porter, Marc Mauer, and Morgan McLeod for feedback, and to Kate Epstein for copy editing.
| 1. | Ghandnoosh, N. (2023). One in five: Ending racial inequity in incarceration. The Sentencing Project. |
|---|---|
| 2. | Robey, J., Massoglia, M., & Light, M. (2023). A generational shift: Race and the declining lifetime risk of imprisonment. Demography, p. 1. https://doi.org/10.1215/00703370-10863378; see also Roehrkasse, A., & Wildeman, C. (2022). Lifetime risk of imprisonment in the United States remains high and starkly unequal. Scientific Advances, 8(48). https://www.science.org/doi/10.1126/sciadv.abo3395 |
| 3. | BBC News. (2020, July 16). George Floyd: What happened in the final moments of his life. BBC News. |
| 4. | Capelouto, S. (2014, December 9). Eric Garner: The haunting last words of a dying man. CNN. |
| 5. | Rojas, R., Bohra, N., & Fawcett, E. (2023, February 12). What we know about Tyre Nichols’s lethal encounter with Memphis police. The New York Times. |
| 6. | Oppel, R. A., Jr, Taylor, D. B., & Bogel-Burroughs, N. (2023, March 9). What to know about Breonna Taylor’s death. The New York Times. |
| 7. | Floyd was suspected of using a counterfeit $20 bill, Garner of selling untaxed loose cigarettes, Nichols of reckless driving, and Taylor of harboring drugs. |
| 8. | Washington Post. (2022, December 5). Police shootings database 2015-2023: Search by race, age, department. Washington Post; Arango, T., & Dewan, S. (2021, October 1). More than half of police killings are mislabeled, new study says. The New York Times; GBD 2019 Police Violence US Subnational Collaborators. (2021). Fatal police violence by race and state in the USA, 1980–2019: a network meta-regression. Lancet, 398: 1239–55; Binder, G., & Yankah, E. Police killings as felony murder. Harvard Law & Policy Review, 17. |
| 9. | This report uses the terms Black and African American interchangeably. |
| 10. | Muhammad, K. G., Western, B., Negussie, Y., & Backes, E. (Eds.) (2022). Reducing racial inequality in crime and justice: science, practice, and policy. National Academies of Sciences, Engineering, and Medicine, p. 6-5. |
| 11. | Asian/Pacific Islander people experience lower rates of victimization than whites. Centers for Disease Control and Prevention. (n.d.) Fatal Injury and Violence Data. |
| 12. | Cooper. A. & Smith, E. L. Homicide trends in the United States, 1980-2008. Bureau of Justice Statistics. |
| 13. | These numbers are based on data from 2018, rather than 2020, to bypass the anomalies created by COVID-19. Tapp, S. N., & Davis, E. J. (2022). Contacts between police and the public, 2020. Bureau of Justice Statistics. |
| 14. | Melamed, S. (2019, October 14). As Philadelphia aims to curb racial disparities, why are police stops of black drivers skyrocketing? The Philadelphia Inquirer; Missouri Attorney General. (2019). Vehicle stops executive summary; Muhammad et al. (2022), see note 10; Lofstrom, M., Hayes, J., Martin, B., and Premkumar, D., and Gumbs, A. (2021). Racial disparities in law enforcement stops. Public Policy Institute of California. |
| 15. | Federal Bureau of Investigation. (2019). Crime in the United States 2019; U.S. Census Bureau. (2021). State and County QuickFacts; Substance Abuse and Mental Health Services Administration (SAMHSA). (2023). Results from the 2021 National Survey on Drug Use and Health; Miech, R., Johnston, L., O’Malley, P., Bachman, J., Schulenberg, J., & Patrick, M. (2022). Monitoring the Future: National survey results on drug use, 1975-2021. The University of Michigan Institute for Social Research. |
| 16. | Chapter 12-1700. Achieving Driving Equality; HB 5058, 2020 Special Session (Virginia 2020) (enacted). |
| 17. | Subramanian, R., & Arzy, L. (2022). Rethinking how law enforcement is deployed. Brennan Center for Justice; Aron, H. (2021, November 23). LA to send outreach workers to nonviolent 911 calls involving homelessness. Courthouse News Service; Legislative Analysis and Public Policy Association. (2021). Law Enforcement Assisted Diversion (LEAD). |
| 18. | DISA Global Solutions (October 2023). Marijuana Legality by State. |
| 19. | John Jay College Research Advisory Group on Preventing and Reducing Community Violence. (2020). Reducing violence without police: A review of research evidence; Sebastian, T., Love, H., Washington, S., Barr, A., Rahman, I., Paradis, B., Perry, A. M., & Cook, S. (2023). A new community safety blueprint: How the federal government can address violence and harm through a public health approach. Brookings; Porter, N. & Komar, L. (2023). Ending mass incarceration: Social interventions that work. The Sentencing Project; Porter, N. & Komar, L. (2023). Safety beyond sentencing. The Sentencing Project; Butts, J., Roman, C., Bostwick, L., & Porter, J. (2015). Cure Violence: A public health model to reduce gun violence. Annual Review of Public Health. p. 36, 39–53. https://doi.org/10.1146/annurev-publhealth-031914-122509. |
| 20. | Mendel, R. (2023). Effective alternatives to youth incarceration. The Sentencing Project; Youth Advocate Programs, Inc. (2022). Answering the call for more effective and equitable outcomes: 2022 Annual Report. YAP, Inc. https://www.yapinc.org/Portals/0/Docs/2022_AR.pdf; Youth Advocate Programs, Inc. (2023). Community-based alternatives to out-of-home placements. YAP, Inc. https://www.yapinc.org/. |
| 21. | Muhammad et al. (2022), see note 10. |
| 22. | Carson, E. A. (2022). Prisoners in 2021 – Statistical tables. Bureau of Justice Statistics. |
| 23. | Beatty, L. G., & Snell, T. L. (2021). Profile of prison inmates, 2016. Bureau of Justice Statistics. |
| 24. | Johnson, T. L, & Johnson, N. N. (2023, March 10). Biggest racial gap in prison is among violent offenders – focusing on intervention instead of incarceration could change the numbers. The Conversation. |
| 25. | Peterson, R., & Krivo, L. (2010) Divergent social worlds: Neighborhood crime and the racial-spatial divide. Russell Sage Foundation; Sampson, R. J., Morenoff, J. D., & Raudenbush, S. W. (2005). Social anatomy of racial and ethnic disparities in violence. American Journal of Public Health, 95(2), 224–232. https://doi.org/10.2105/AJPH.2004.037705; Muhammad et al. (2022), see note 10. |
| 26. | U.S. Census Bureau (2023). QuickFacts. |
| 27. | These arrest figures for African Americans include those who are also Latinx. The violent crimes included here are: aggravated assault, robbery, rape, and murder and nonnegligent manslaughter; the property crimes are burglary, larceny-theft, motor vehicle theft, and arson. Federal Bureau of Investigation. (2020). Crime in the United States, 2019. Table 43. |
| 28. | Overall, Latinxs of all races comprise 19% of the U.S. population and accounted for 25% of arrests for serious violent crimes (21% for murder and nonnegligent manslaughter) and 17% of arrests for property crimes. American Indians or American or Alaska Native people (including those who are Latinx) comprise 1.3% of the U.S. population and accounted for 2.3% of arrests for serious violent crimes (1.6% for murder and nonnegligent manslaughter) and 1.9% of arrests for property crimes. Federal Bureau of Investigation. (2020). Crime in the United States, 2019. Table 43; U.S. Census Bureau (2023). QuickFacts; KFF’s State Health Facts. Poverty rate by race/ethnicity (2021). Data Source: KFF estimates based on the 2008-2021 American Community Survey, 1-Year Estimates. |
| 29. | Beck, A. J. (2021). Race and ethnicity of violent crime offenders and arrestees, 2018. Bureau of Justice Statistics; Loeber R, Farrington DP, Hipwell AE, Stepp SD, Pardini D, Ahonen L. (2015). Constancy and change in the prevalence and frequency of offending when based on longitudinal self-reports or official records: Comparisons by gender, race, and crime type. Journal of Developmental and Life-Course Criminology, 1(2), 150–168. https://doi.org/10.1007/s40865-015-0010-5; Piquero, A. R., Schubert, C. A., & Brame, R. (2014). Comparing official and self-report records of offending across gender and race/ethnicity in a longitudinal study of serious youthful offenders. Journal of Research in Crime and Delinquency, 51(4), 526–556. https://doi.org/10.1177/0022427813520445 |
| 30. | Muhammad et al. (2022), see note 10; see also Thompson, A., & Tapp, S. (2022). Criminal victimization, 2021. Bureau of Justice Statistics. |
| 31. | Asian/Pacific Islander people experience lower rates of victimization than whites. Centers for Disease Control and Prevention. (n.d.) Fatal injury and violence data. |
| 32. | Cooper. A. & Smith, E. L. Homicide trends in the United States, 1980-2008. Bureau of Justice Statistics. |
| 33. | The remainder might be caused by racial bias and discrimination after the point of arrest, as well as by factors such as racial differences in criminal histories which affects sentencing. Beck, A. J., & Blumstein, A. (2018). Racial disproportionality in U.S. State Prisons: Accounting for the effects of racial and ethnic differences in criminal involvement, arrests, sentencing, and time served. Journal of Quantitative Criminology, 34(3), 853–883. https://doi.org/10.1007/s10940-017-9357-6; Blumstein, A. (1993). Racial disproportionality of U.S. prison populations revisited. University of Colorado Law Review, 64, 743–760; Blumstein, A. (1982). On the racial disproportionality of United States’ prison populations. Journal of Criminal Law and Criminology, 73, 1259–1281. |
| 34. | Muhammad et al. (2022), see note 10, p. 6-5. |
| 35. | John Jay College Research Advisory Group on Preventing and Reducing Community Violence (2020), see note 19; Sebastian et al. (2023), see note 19. |
| 36. | Porter & Komar (2023). Ending mass incarceration: Social interventions that work. The Sentencing Project; Mendel, R. (2023). Effective alternatives to youth incarceration. The Sentencing Project. |
| 37. | Cure Violence (2021). The evidence of effectiveness. |
| 38. | Youth Advocate Programs, Inc. (2022), see note 20; Youth Advocate Programs, Inc. (2023), see note 20. |
| 39. | International Association of Chiefs of Police. (n.d.) Firearms policy position statement. |
| 40. | Zahniser, D. (2023, March 2). LAPD officers could stop responding to some nonviolent calls. Los Angeles Times. |
| 41. | Substance Abuse and Mental Health Services Administration (SAMHSA). (2023). Results from the 2021 National Survey on Drug Use and Health; SAMHSA. (2020). Results from the 2018 National Survey on Drug Use and Health: Detailed tables; see also Mitchell, O. (2009). Is the War on Drugs racially biased? Journal of Crime & Justice, 32(2), 49–75. https://doi.org/10.1080/0735648x.2009.9721270 |
| 42. | Beckett, K., Nyrop, K., & Pfingst, L. (2006). Race, drugs, and policing: Understanding disparities in drug delivery arrests. Criminology, 44(1), 105–37. https://doi.org/10.1111/j.1745-9125.2006.00044.x; Riley, K. J. (1997). Crack, powder cocaine, and heroin: Drug purchase and use patterns in six major U.S. cities. National Institute of Justice. |
| 43. | Drug arrests comprised 15% of all non-traffic arrests in 2019. Federal Bureau of Investigation. (2019). Crime in the United States 2019 – Arrest table. |
| 44. | Federal Bureau of Investigation. (2019). Crime in the United States 2019; U.S. Census Bureau. (2021). State and County QuickFacts; Substance Abuse and Mental Health Services Administration (SAMHSA). (2023). Results from the 2021 National Survey on Drug Use and Health; Miech et al. (2022), see note 15. |
| 45. | Edwards, E., Madubuonwu, B., & Greytak, E. (2020). A tale of two countries: Racially targeted arrests in the era of marijuana reform. American Civil Liberties Union; Substance Abuse and Mental Health Services Administration (SAMHSA). (2019). Results from the 2019 National Survey on Drug Use and Health. |
| 46. | Carson (2022), see note 22; Center for Behavioral Health Statistics and Quality. (2021). Racial/ethnic differences in substance use, substance use disorders, and substance use treatment utilization among people aged 12 or older (2015-2019). |
| 47. | Brame, R., Bushway, S. D., Paternoster, R., & Turner, M. G. (2014). Demographic patterns of cumulative arrest prevalence by ages 18 and 23. Crime & Delinquency, 60(3), 471–486. https://doi.org/10.1177/0011128713514801 |
| 48. | Overall, 62 million U.S. residents had contact with the police in 2018, which includes 35 million interactions that people initiated and nine million interactions related to a traffic accident (all forms of police contact add up to more than the total since some individuals experienced multiple types of contact). Of the approximately 24 million traffic stop encounters in 2018, 18.7 million (77%) were experienced by drivers and 5.7 million (23%) were experienced by passengers. Tapp & Davis. (2022), see note 13. |
| 49. | This study found the state-patrol stop rate to be 7% for whites, 10% for Blacks, 5% for Latinxs. The municipal-police stop rate was 14% for whites, 20% for Blacks, 9% for Latinxs. Pierson, E., Simoiu, C., Overgoor, J., Corbett-Davies, S., Jenson, D., Shoemaker, A., Ramachandran, V., Barghouty, P., Phillips, C., Shroff, R., & Goel, S. (2020). A large-scale analysis of racial disparities in police stops across the United States. Nature Human Behaviour, 4(7), 736–745. https://doi.org/10.1038/s41562-020-0858-1 |
| 50. | See Grogger, J. & Ridgeway, G. (2006). Testing for racial profiling in traffic stops from behind a veil of darkness. Journal of the American Statistical Association. 101, 878–887. https://doi.org/10.1198/016214506000000168. |
| 51. | Barone, K., Fazzalaro, J., Kalinowski, J., & Ross, M. B. (2022) Traffic stop data analysis and findings, 2020. Institute for Municipal and Regional Policy, University of Connecticut; Flingai, S., Sahaf, M., Battle, N. & Castaneda, S. (2022). An analysis of racial disparities in police traffic stops in Suffolk County, Massachusetts, from 2010 to 2019. Vera Institute of Justice; Baumgartner, F., Epp, D., & Shoub, K. (2018). Suspect citizens: What 20 million traffic stops tell us about policing and race. Cambridge University Press; Horn, C. (2020, June 12.) Racial disparities revealed in massive traffic stop dataset. University of South Carolina. |
| 52. | Bureau of Justice Statistics. Contacts between police and the public. |
| 53. | McIntire, M., & Keller, M. H. (2021, November 3). The demand for money behind many police traffic stops. The New York Times. |
| 54. | Epp, C. R., Maynard-Moody, S., & Haider-Markel, D. P. (2014). Pulled over: How police stops define race and citizenship. University of Chicago Press, p. 64, emphasis in original. |
| 55. | This study is based on drivers’ reports of officers’ reasons for the stop. Epp, Maynard-Moody, & Haider-Markel (2014), see note 54; for a similar study of traffic stops for non-moving violations in California, see Muhammad et al. (2022), see note 10. |
| 56. | Latinx drivers in North Carolina were also more likely to be stopped for investigatory rather than for traffic safety reasons. Baumgartner, Epp, & Shoub (2018), see note 51. |
| 57. | Floyd v. City of N.Y., 959 F. Supp. 2d 540, 562 (S.D.N.Y. 2013). |
| 58. | Rosenfeld, R. & Fornango, R. (2014). The impact of police stops on precinct robbery and burglary rates in New York City. Justice Quarterly, 31(1), 96-122. https://doi.org/10.1080/07418825.2012.712152; Keating, D., & Stevens, H. (2020, February 27). Bloomberg said ‘stop and frisk’ decreased crime. Data suggests it wasn’t a major factor in cutting felonies. |
| 59. | Crime and Justice Institute (2022). City of Milwaukee settlement agreement: Analysis of 2022 traffic stops, field interviews, no-action encounters, and frisks; ACLU-DC & ACLU Analytics. (2020). Racial disparities in stops by the DC Metropolitan Police Department: Review of five months of data; Wisconsin State Journal. (2022, May 12). ACLU, Milwaukee police stop-and-frisk resolution efforts continue; ACLU Illinois. (2023). Stop and frisk; Palmer, C., & Orso, A. (2023, March 17). Stop-and-frisk is getting renewed attention in Philly amid a mayor’s race focused on crime. The Philadelphia Inquirer. |
| 60. | Goodman, J. D. (2017, October 20). Fewer criminal tickets for petty crimes, like public urination. The New York Times; Konig, J. (2022, March 23). NYPD launches “quality-of-life” initiative that critics call return to “broken windows” policing. Spectrum News NY1. |
| 61. | Weisburd, D., & Majmundar, M. K. (Eds.) (2018). Proactive policing: Effects on crime and communities. National Academies of Sciences, Engineering, and Medicine. https://doi.org/10.17226/24928 |
| 62. | Tapp & Davis. (2022), see note 13. |
| 63. | Harris, D. (2012). Hearing on “Ending Racial Profiling in America,” Testimony of David A. Harris. United States Senate Judiciary Committee, Subcommittee on the Constitution, Civil Rights, and Human Rights; Pierson et al. (2020), see note 49. |
| 64. | Melamed (2019), see note 14; Missouri Attorney General. (2019). Vehicle stops executive summary; Muhammad et al. (2022), see note 10; Lofstrom et al. (2021), see note 14. |
| 65. | Tapp & Davis (2022), see note 13; Muhammad et al. (2022), see note 10. |
| 66. | This includes if the officer threatened force, handcuffed, pushed or grabbed, hit or kicked, used chemical or pepper spray, used an electroshock weapon, pointed or fired a gun, or used another type of physical force. Tapp & Davis (2022), see note 13. |
| 67. | Tapp & Davis (2022), see note 13. |
| 68. | Voigt, R., Camp, N.P., Prabhakaran, V., Hamilton, W.L., Hetey, R.C., Griffiths, C.M., Jurgens, D., Jurafsky, D., & Eberhardt, J.L. (2017). Language from police body camera footage. shows racial disparities in officer respect. Proceedings of the National Academy of Sciences, 114(25), 6521–6526. |
| 69. | These data exclude the minority of killings by police that do not involve a firearm. Muhammad et al. (2022), see note 10. |
| 70. | Edwards F, Lee H, Esposito M. (2019). Risk of being killed by police use of force in the United States by age, race-ethnicity, and sex. PNAS 116(34),16793–98. |
| 71. | Mendel, R. (2022). Diversion: A hidden key to combating racial and ethnic disparities in juvenile justice. The Sentencing Project. |
| 72. | Civil Rights Division, U.S. Department of Justice & Office for Civil Rights, U.S. Department of Education (2014). Dear colleague letter on the nondiscriminatory administration of school discipline. |
| 73. | Tapp & Davis (2022), see note 13. |
| 74. | Brunson, R. K. (2007). “Police don’t like black people”: African-American young men’s accumulated police experiences. Criminology & Public Policy, 6(1), 71–102; Tyler, T. R., Fagan, J., and Geller, A. (2014). Street stops and police legitimacy: Teachable moments in young urban men’s legal socialization. Journal of Empirical Legal Studies, 11(4), 751–785. https://doi.org/10.1111/jels.12055 |
| 75. | Jones, B. J. M. (2022, July 21). In U.S., Black confidence in police recovers from 2020 low. Gallup.com; Morin, R., & Stapler, R. (2016) The racial confidence gap in police performance. Pew Research Center. |
| 76. | Between 2000 and 2019, police identified information about a suspect (an estimate of the clearance rate—which is the proportion of cases in which a suspect is arrested or the case is otherwise closed) in 62% of murders involving African American victims, 65% of those involving Latinx victims, and over 80% of those involving American Indian or white victims. Muhammad et al. (2022), see note 10; see also Hacker, C., Mosk, M., & Axelrod, J. (2022, June 29). A “coin flip”: Nearly half of U.S. murders go unsolved as cases rise. CBS News. |
| 77. | Morin, R., Parker, K., Stepler, R. & Mercer, A. (2017). Behind the badge. Pew Research Center. |
| 78. | Travis, J., Western, B., & Redburn, S. (Eds.) (2014). The growth of incarceration in the United States: Exploring causes and consequences. National Academies of Sciences, Engineering, and Medicine; Weisburd & Majmundar (2018), see note 61; Stagoff-Belfort, A., Bodah, D., & Gilbert, D. (2022) The social costs of policing. Vera Institute of Justice. |
| 79. | Rodricks, D. (2015, April 23). Freddie Gray a victim of America’s longest war. Baltimore Sun; Balko, R. (2014, September 3). How municipalities in St. Louis County, Mo., profit from poverty. Washington Post; Peters, J. (2014, December 3). Broken Windows Policing doesn’t work. It also may have killed Eric Garner. Slate; McIntire & Keller (2021), see note 53. |
| 80. | United States Department of Justice Civil Rights Division (2015). Investigation of the Ferguson Police Department, p. 2. |
| 81. | DISA Global Solutions (2023) see note 18; Schaeffer, K. (2023, April 13). 7 facts about Americans and marijuana. Pew Research Center. |
| 82. | Federal Bureau of Investigation. (2019). Crime data explorer. Note: arrest data from 2019 were used since they occurred before the pandemic, when marijuana arrest rates became anomalously low, and because law enforcement participation in the FBI’s crime data collection system decreased after 2019. Drug arrests comprised 15% of all non-traffic arrests in 2019. See: Krishnakumar, P. (2022, October 5). The FBI released its crime report for 2021–but it tells us less about the overall state of crime in the US than ever. CNN. |
| 83. | Mehta, J. (2021, November 8). Why Philadelphia has banned low-level traffic stops. NPR. |
| 84. | Chapter 12-1700, see note 16. |
| 85. | Williams, S. (2023, March 10). City’s first group of public safety enforcement officers sworn in. The Philadelphia Tribune. |
| 86. | Justice Forward Virginia. (2022). Success story: Many policing “pretexts” eliminated in Virginia. |
| 87. | HB 5058 (Virginia 2020), see note 16; Mehta (2021), see note 83. |
| 88. | Weichselbaum, S., Siegel, E.R., & Blankstein, A. (2021, October 7). Police face a ‘crisis of trust’ with black motorists. One state’s surprising policy may help. NBC News. |
| 89. | Orso, A. (2023, March 30). Philly court tosses police union lawsuit over driving equality law. The Philadelphia Inquirer; Caiola, S. (2023, March 30). Philadelphia’s Driving Equality Act remains in place after court rules against police union. NPR. |
| 90. | Moomaw, G. (2023, Oct 3). Progressive groups blast Virginia Municipal League over traffic stop stance. Virginia Mercury. |
| 91. | Vera Institute of Justice. (2021). Investing in evidence-based alternatives to policing: Non-police responses to traffic safety; Jallow, A. (2021, April 15). What would happen if cops didn’t make certain traffic stops? This North Carolina city offers a case study. USA Today; Valencia, N. (2023, April 12). Memphis leaders pass measure that ends police stops for minor infractions, three months after Tyre Nichols’ death. CNN; Stanton, R. (2023, July 7). Michigan’s first driving equality ordinance gets 10-0 final OK in Ann Arbor. MLive. |
| 92. | Office of the Ramsey County Attorney, John Choi. (2021). Charging policy regarding non-public safety traffic stops. |
| 93. | Dholakia, N., & Johnson, A. (2022). Low-level traffic stops too often turn deadly. Some places are trying to change that. Vera Institute of Justice. |
| 94. | Floyd v. City of N.Y., see note 57. |
| 95. | ACLU New York. (2023). Stop-and-frisk data. |
| 96. | ACLU-DC & ACLU Analytics. (2020). Racial disparities in stops by the DC Metropolitan Police Department: Review of five months of data; Wisconsin State Journal. (2022, May 12). ACLU, Milwaukee police stop-and-frisk resolution efforts continue; ACLU Illinois. (2023). Stop and frisk; Palmer, C., & Orso, A. (2023, March 17). Stop-and-frisk is getting renewed attention in Philly amid a mayor’s race focused on crime. The Philadelphia Inquirer. |
| 97. | Gomez, M. (2021, February 16). L.A. school board cuts its police force and diverts funds for black student achievement. Los Angeles Times. |
| 98. | Muhammad et al. (2022), see note 10. |
| 99. | Riser-Kositsky, M., Sawchuk, S., & Peele, H. (2021, June 04). School police: Which districts cut them? Which brought them back? Education Week. |
| 100. | While only four in every 100 adults in America are reported to have serious mental illnesses, this population accounts for at least 10% of calls for police service. People with serious mental illnesses are at significantly higher risk of experiencing police violence than the general public, with one in four fatal police shootings involving someone with mental illness. Fuller, D., Lamb., H.R., Biasotti, M., & Snook, J. (2015). Overlooked in the undercounted: the role of mental illness in fatal law enforcement encounters. Treatment Advocacy Center; Laniyonu, A., & Goff, P.A. (2021). Measuring disparities in police use of force and injury among persons with serious mental illness. BMC Psychiatry, 21(500), 1-8. https://doi.org/10.1186/s12888-021-03510-w; Berman, M., Sullivan, J., Tate, J., & Jenkins, J. (2020, June 8). Protests spread over police shootings. Police promised reforms. Every year, they still shoot and kill nearly 1,000 people. Washington Post. |
| 101. | Alonso-Zaldivar, R. (2021, April 23). Feds fund mental health crisis teams to stand in for police. AP News. |
| 102. | Subramanian & Arzy (2022), see note 17. |
| 103. | Thompson, C. (2020, July 24). This city stopped sending police to every 911 call. The Marshall Project; CAHOOTS Media Guide. (2020). Crisis assistance helping out the streets: White Bird Clinic, Eugene, Oregon. |
| 104. | Aron (2021), see note 17; Witte, G. (2021, October 9). In New Mexico, a bold experiment aims to take police out of the equation for mental health calls. Washington Post; Atmonavage, J. (2021, November 30). Mental health experts will assist state troopers as they respond to crisis calls in groundbreaking N.J. program. NJ.com; Thompson (2020), see note 103. |
| 105. | Collins, S.E., Lonczak, H.S., & Clifasefi, S.L. (2015). LEAD Program Evaluation: Recidivism Report. University of Washington; Legislative Analysis and Public Policy Association (2021), see note 17. |
| 106. | See: Redmond, H. (2020, September 17). The LEAD program faces a reckoning for centering police. Filter Magazine. |
| 107. | Alpert, G. & Smith, W. (1994). How reasonable is the reasonable man?: Police and excessive force. Journal of Criminal Law and Criminology, 85(2), 481–501. |
| 108. | Subramanian, R., & Arzy, L. (2021). State policing reforms since George Floyd’s murder. Brennan Center for Justice. |
| 109. | Subramanian & Arzy (2021), see note 108; Council on Criminal Justice, Task Force on Policing. (2021). Duty to intervene: Policy assessment. |
| 110. | Council on Criminal Justice, Task Force on Policing. (2020). Priorities for state policing reform. |
| 111. | McConney Moore, K. (2020, September 10). For civilian review boards to work, they must avoid past mistakes. ACLU Connecticut; Council on Criminal Justice, Task Force on Policing. (2021). Civilian oversight: Policy assessment; Council on Criminal Justice (2020), see note 110. |
| 112. | Walker, S. (2022). The Justice Department’s Pattern-or-Practice police reform program, 1994–2017: Goals, achievements, and issues. Annual Review of Criminology, 5(1). https://doi.org/10.1146/annurev-criminol-030920-102432 |
| 113. | Greenhouse, S. (2020, June 18). How police unions enable and conceal abuses of power. The New Yorker. |
| 114. | Sibilla, N. (2021, January 9). New Massachusetts law will decertify rogue cops, revoke their immunity. Forbes. |
| 115. | Congressional Research Service. (2014). Special prosecutors: Investigations and prosecutions of police use of deadly force; Jawando, M., & Parsons, C. (2014, December 18). 4 ideas that could begin to reform the criminal justice system and improve police-community relations. Center for American Progress; Alcindor, Y. (2014). Wis. bill mandates rules for officer-involved deaths. USA Today. |
| 116. | Council on Criminal Justice, Task Force on Policing. (2021). Qualified immunity: Policy assessment. |
| 117. | H.R. 1280 – 117th Congress (2021-2022): George Floyd Justice in Policing Act of 2021. (2021, March 9). |
| 118. | International Association of Chiefs of Police. (2021, March 4). Letter to congressional leaders regarding George Floyd Justice in Policing Act; National Fraternal Order of Police. (2021, March 2). National FOP president statement on the George Floyd Justice in Policing Act. |
| 119. | McElvain, J. & Kposowa, A. (2008). Police officer characteristics and the likelihood of using deadly force. Criminal Justice and Behavior, 35(4), 505–521. https://www.doi.org/10.1177/0093854807313995; Ba, B. A., Knox, D., Mummolo, J., & Rivera, R. (2021). The role of officer race and gender in police-civilian interactions in Chicago. Science, 371(6530), 696-702. https://doi.org/10.1126/science.abd8694; Hoekstra, M., & Sloan, C.W. Does race matter for police use of force? Evidence from 911 calls. American Economic Review, 112(3), 827-860. https://doi.org/10.1257/aer.20201292; Mummolo, J. (2023, February 2). Don’t give up on diversifying the police. The Washington Post. |
| 120. | Leatherby, L. & Oppel, R. A. Jr. (2020, September 23). Which Police Departments Are as Diverse as Their Communities? New York Times. |
| 121. | Goodison, S. E. (2022). Local police departments personnel, 2020. Bureau of Justice Statistics. |
| 122. | CPE statement on the police killing of Tyre Nichols in Memphis, Tennessee. (2023, January 24). Center for Policing Equity. |
| 123. | Sim, J., Correll, J., & Sadler, M. (2013). Understanding police and expert performance: When training attenuates (vs. exacerbates) stereotypic bias in the decision to shoot. Personality and Social Psychology Bulletin, 39(3), 291–304. https://doi.org/10.1177/0146167212473157; Worden, R., McLean, S., Engel, R., Cochran, H., Corsaro, N., Reynolds, D., Najdowski, C., & Isaza, G. (2020). The impacts of implicit bias awareness training in the NYPD. Center for Police Research and Policy; Lai, C., & Lisnek, J. (2023). The impact of implicit-bias-oriented diversity training on police officers’ beliefs, motivations, and actions. Psychological Science, 34(1), 424-434. https://doi.org/10.1177/09567976221150617 |
| 124. | Eberhardt, J.L. (2020). Biased: Uncovering the hidden prejudice that shapes what we see, think, and do. Penguin Books, p. 282. |
| 125. | Lum, C., Stoltz, M., Koper, C.S., & Scherer, J. (2019). Research on body-worn cameras: What we know, what we need to know. Criminology & Public Policy, 18(1), 93-118. https://doi.org/10.1111/1745-9133.12412; McClure, D., La Vigne, N., Lynch, M., Golian, L., Lawrence, L., & Malm, A. (2017 June). How body cameras affect community members’ perceptions of police. The Urban Institute. |
| 126. | Zamoff, M., Greenwood, B., & Burtch, G. (2022). Who watches the watchmen: Evidence of the effect of body-worn cameras on New York City policing. The Journal of Law, Economics, and Organization, 38(1), 161-195. https://doi.org/10.1093/jleo/ewab026; Williams Jr., M. C., Weil, N., Rasich, R. A., Ludwig, J., Chang, H. & Egrari, S. (2021 March). Body-worn cameras in policing: Benefits and costs. National Bureau of Economic Research. https://doi.org/10.3386/w28622 |
| 127. | Zahniser, D. (2022, June 1). L.A.’s police union spending big on city elections, seeking to boost City Hall influence. Los Angeles Times; Scheiber, N., Stockman, F., & Goodman, J.D. (2021, April 2). How police unions became such powerful opponents to reform efforts. The New York Times; Perkins, T. (2020, June 23). Revealed: police unions spend millions to influence policy in biggest US cities. The Guardian; Rad, A.N., Kirk, D.S., & Jones, W.P. (2023). Police unionism, accountability, and misconduct. Annual Review of Criminology, 6, 181-203. https://doi.org/10.1146/annurev-criminol-030421-034244 |
| 128. | Kindy, K. (2021, October 7). Dozens of states have tried to end qualified immunity. Police officers and unions helped beat nearly every bill. Washington Post; Evers-Hillstrom, K. (2023, March 14). DC police union hired lobbyists in effort to overturn crime bills. The Hill |
| 129. | Segelbaum, D. (2022, July 25). Ivan Bates, Democratic nominee for Baltimore state’s attorney: ‘You will be held accountable, and you will go to jail’. The Baltimore Banner; Rouhani, S., Tomko, C., Weicker, N. P., & Sherman, S. G. (2021). Evaluation of prosecutorial policy reforms eliminating criminal penalties for drug possession and sex work in Baltimore, Maryland. Department of Health, Behavior, and Society, Johns Hopkins University; Prudente, T. (2021, October 19). Hopkins researchers find no uptick in crime, complaints after Marilyn Mosby stops prosecuting drug possession. The Baltimore Sun; Merrefield, C. (2023, February 14). Choosing not to prosecute low-level crimes may reduce future crime, research finds. The Journalist’s Resource. |
| 130. | The citation program looks to defer individuals from formal processing, but will lead to prosecution after a third infraction. Prudente, T. & Segelbaum, D. (2023, June 1). Baltimore to resume enforcement of nonviolent offenses. The Baltimore Banner; Trivedi, S. & Warnken, H. (2023, Aug 14). Baltimore’s new citation policy won’t make us safer — just poorer | GUEST COMMENTARY. The Baltimore Sun; O’Neill, M. (2023, June 1). Bates introduces citation docket for ‘quality-of-life offenses’ in Baltimore. The Daily Record. |
| 131. | Merrefield (2023), see note 129; Huzinga, D. & Henry, K. (2008). The effect of arrest and justice system sanctions on subsequent behavior: Findings from longitudinal and other studies. The Long View of Crime: A Synthesis of Longitudinal Research. https://doi.org/10.1007/978-0-387-71165-2_7 |
| 132. | Bolstad, E. (2023, September 12). Drug decriminalization stumbled in Oregon. Other states are taking note. StateLine. |
| 133. | Oregon Health Authority (2023). Too early to tell: The challenging implementation of Measure 110 has increased risks, but the effectiveness of the program has yet to be determined. Oregon Secretary of State. |
| 134. | Riser-Kositsky, Sawchuk, & Peele (2021), see note 99. |
| 135. | Arango, T. (2023, June 27). Schools bring police back to campuses, reversing racial justice decisions. New York Times; Mendel, R. (2022). Data revelase violence among youth under 18 has not spiked in the pandemic. The Sentencing Project. |
| 136. | Riser-Kositsky, Sawchuk, & Peele (2021), see note 99. |
| 137. | Sorensen, L. C., Acosta, M. A., Engberg, J., & Bushway, S. D. (2023). The thin blue line in schools: New evidence on school-based policing across the U.S. Annenberg Institute at Brown University. https://doi.org/10.26300/heqx-rc69. |
| 138. | Ghandnoosh, N. (2023). Media guide: 10 crime coverage dos and don’ts. The Sentencing Project. |


