Ending 50 Years of Mass Incarceration: Urgent Reform Needed to Protect Future Generations
Fifty years since the onset of mass incarceration, and despite recent downsizing of most state prison populations, the pace of decarceration is insufficient to undo the decades of unrelenting growth.
Related to: Incarceration, Sentencing Reform
By year end 2021, the U.S. prison population had declined 25% since reaching its peak in 2009.1 Still, the 1.2 million people imprisoned in 2021 were nearly six times the prison population 50 years ago, before the prison population began its dramatic growth.2 The United States remains a world leader in incarceration, locking up its citizens at a far higher rate than any other industrialized nation.3
At the current pace of decarceration, averaging 2.3% annually since 2009, it would take 75 years—until 2098—to return to 1972’s prison population.
It is unacceptable to wait more than seven decades to substantively alter a system that violates human rights and is out of step with the world, is racially biased, and diverts resources from effective public safety investments.4 To achieve meaningful decarceration, policymakers must reduce prison admissions and scale back sentence lengths—both for those entering prisons and those already there. The growing movement to take a “second look” at unjust and excessive prison terms is a necessary first step.5 As the country grapples with an uptick in certain crimes, ending mass incarceration requires accelerating recent reforms and making effective investments in public safety.
Figure 1. Historical and Projected U.S. State and Federal Prison Population, Based on 2009-2021 Rate of Decline
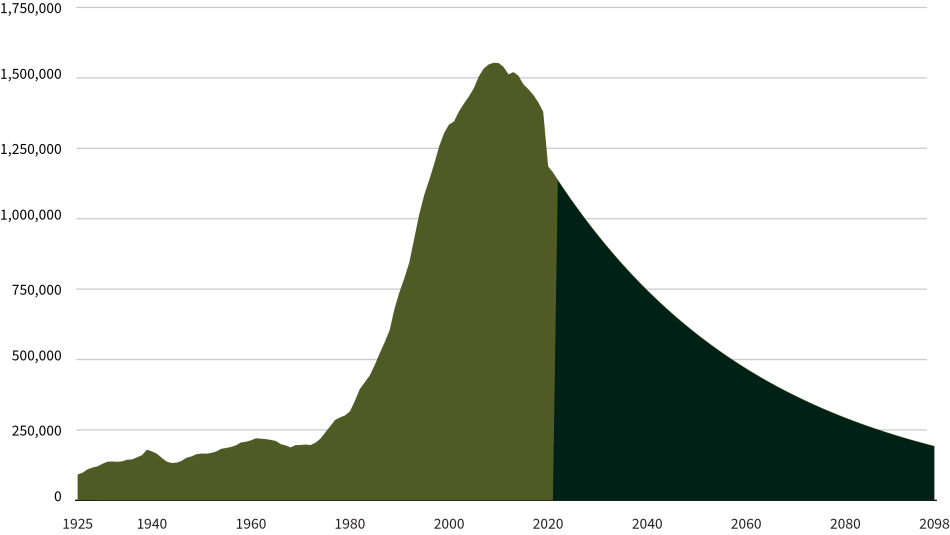
Source of historical figures: Bureau of Justice Statistics. (1982). Prisoners 1925-81; Bureau of Justice Statistics Corrections Statistical Analysis Tool; Carson, E. A. (2022). Prisoners in 2021–Statistical tables. Bureau of Justice Statistics. Figure 1. Historical and Projected U.S. State and Federal Prison Population, Based on 2009-2021 Rate of Decline.
Figure 2. Pace of Growth and Reduction in U.S. Prison Population

Source: Bureau of Justice Statistics. (1982). Prisoners 1925-81; Bureau of Justice Statistics Corrections Statistical Analysis Tool; Carson, E. A. (2022). Prisoners in 2021–Statistical tables. Bureau of Justice Statistics.
Rapid Buildup, Modest Decline
During the buildup of mass incarceration, between 1972 and 2009, the prison population grew an average of 5.8% annually. Since then, the pace of decarceration has been less than half the rate of growth—averaging 2.3% each year, which includes an anomalous 14.1% drop in 2020 in response to the COVID-19 pandemic.6 In 2021, the number of people serving prison sentences declined 1.9%, resuming the slower pre-pandemic pace of decarceration.
Significant Variation Across States
Nationally, a return to 1972’s level of imprisonment would represent an 87% reduction in the prison population since the peak level in 2009. The U.S. youth justice system has already achieved reductions close to this magnitude: the number of youth held in juvenile justice facilities fell from a peak of 109,000 in 2000 to 25,000 in 2020, a 77% decline.7 Some states are well on their way to achieving this level of decarceration in adult prisons as well (see Figure 3). Connecticut,8 New Jersey, and New York have reduced their prison populations over 50% since reaching peak levels. Twenty-five states have reduced their prison populations by over 25% since reaching their peaks, outpacing the national average level of decarceration. The federal prison population downsized 27% relative to its peak in 2011.9
Along with recent prison population reductions, several states have seen significant declines in crime, sometimes outpacing nationwide crime trends.10 For example, between 1999 and 2020, when New York more than halved its prison population, the state’s violent crime rate fell by 38% while the U.S. violent crime rate fell by 24%.11 Decarceration has also helped New York and several other states close, and in some cases repurpose, correctional facilities.12
Figure 3. U.S. Prison Population Trends Through 2021: Decreases Since Peak Year
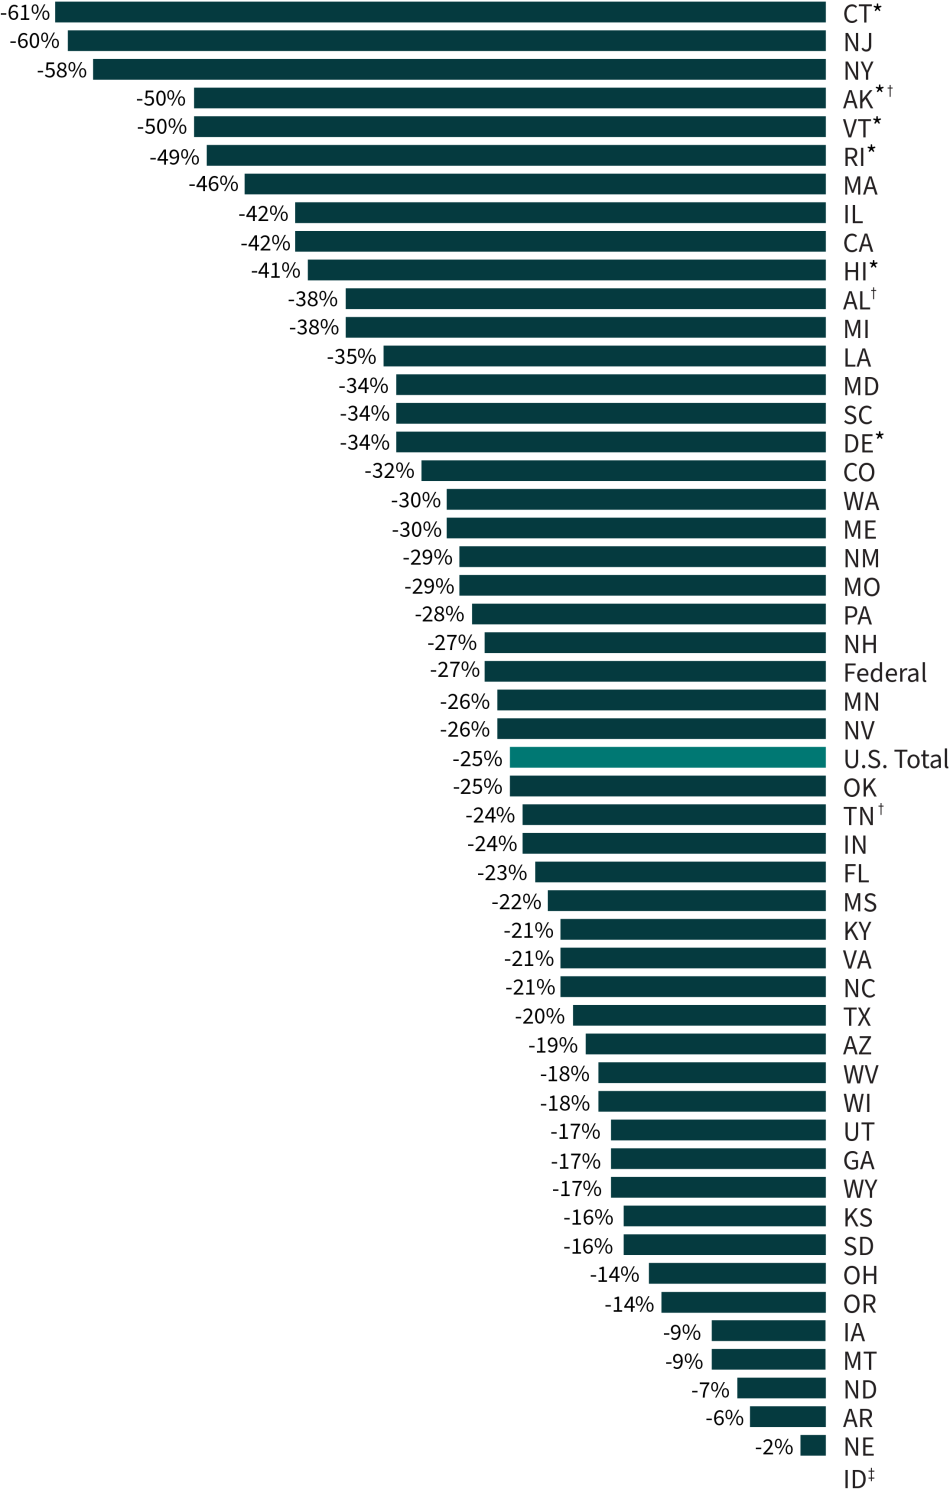
Source: Bureau of Justice Statistics Prisoners Series (1999-2021)
Note: See Table 1 for additional details.
* Data include jail populations because prisons and jails are an integrated system in these states.
† Alabama, Alaska, and Tennessee are poised to reverse some of this progress. See page 4 for more details.
‡ Idaho changed its counting methodology in 2021, causing data incompatibility across years. In 2020, the state downsized its prisons 14% since reaching its peak level the prior year.
Yet dangerous overcrowding persists in many jurisdictions and some policymakers plan to further expand incarceration levels. In Alabama, plans are underway to build additional prisons rather than reduce a still-bloated prison system, and the federal government is suing the state alleging serious Constitutional violations in its prisons.13 Prompted by its governor, in 2019 Alaska’s state legislature repealed several aspects of a major criminal justice overhaul, Senate Bill 91.14 In 2022, Tennessee legislators expanded the state’s “truth in sentencing” law, requiring some individuals to serve 100% of their sentences.15
Given the dire consequences of mass incarceration and the breadth of evidence of its limited, and sometimes counterproductive, impact on public safety, the pace of decarceration has been far too slow in many states, and several jurisdictions have turned in the wrong direction. Five states have downsized their prisons by less than 10% since reaching peak levels: Nebraska, Arkansas, North Dakota, Montana, and Iowa. What is more, after intensifying decarceration to mitigate the impact of COVID in 2020,16 the federal system and 12 states grew their sentenced prison populations in 2021. The federal prison system expanded 3% in 2021, and continued to grow in 2022.17
Meaningful Decarceration Requires Reforms for Extreme Sentences
The United States has made only modest progress toward ending mass incarceration amidst a dramatic crime drop. By year end 2019, crimes reported to the police had plummeted to half of their 1990s level—just as they did in many other countries that did not increase imprisonment levels18 (see Figure 4). But U.S. imprisonment levels continued to increase for nearly two decades while crime rates declined, and have since declined only modestly. In 2020, amidst the COVID-19 pandemic, violent crime rates increased—with homicides spiking—while property crimes continued their decline.19 In 2021, homicide increased again, but at a slower rate, while other violent crimes decreased overall, as did property crimes.20 Policymakers must now effectively respond to this uptick in lethal violence through evidence-based responses,21 while correcting the counterproductive, costly, and cruel responses of the past. Expediting the end of mass incarceration requires reducing prison admissions and scaling back sentences for both those entering prisons and those already there.
Past reforms have reduced the number of people imprisoned for a drug offense by 46% between peak year 2007 and 2020 (see Figure 5). The number of people imprisoned for a property offense has declined 46% between peak year 2007 and 2020. But for the majority (56%) of the prison population imprisoned for a violent crime—which generally ranges from robbery and assault to rape and murder—sentencing relief remains elusive.22 Overall, the number of people imprisoned for a violent offense has declined by only 10% between peak year 2009 and 2020, despite violent crimes falling by 50% between peak year 1991 and 2020.23 Longer prison terms have prevented this segment of the prison population from contracting amidst the historic crime drop.24
A key driver of mass incarceration has been the dramatic growth in length of imprisonment, including the unprecedented growth in life imprisonment.25 The population serving life sentences in 2020 exceeded the total prison population in 1970.26 The unwillingness to scale back extreme sentences is at odds with evidence that long sentences incapacitate older people who pose little public safety threat, produce limited deterrent effects, and detract from more effective investments in public safety.27 Ending mass incarceration will require moderating prison terms for violence as well as minimizing imprisonment and prison terms for non-violent crimes.
Figure 4. Reported Violent Crimes, 1985-2020
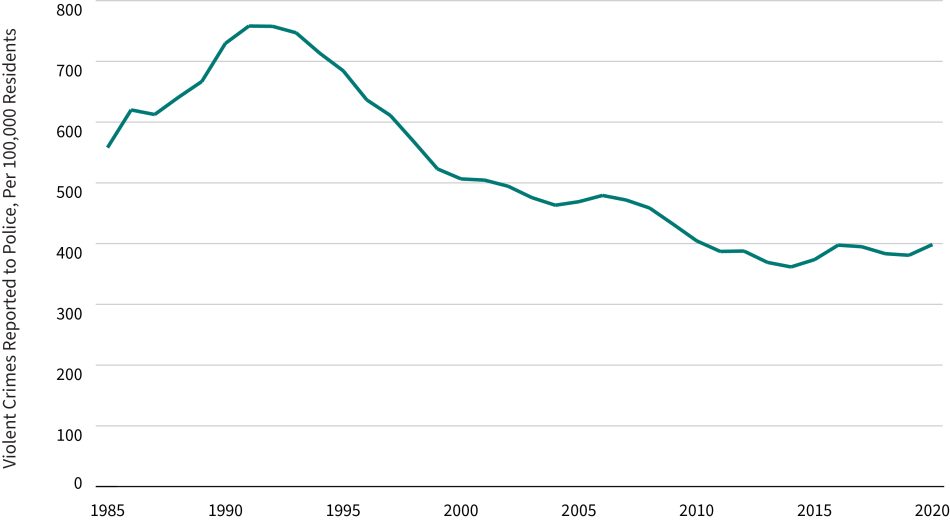
Source: Federal Bureau of Investigation. (2023). Crime data explorer.
Figure 5. U.S. Prison Population by Conviction Offense, 1980-2020
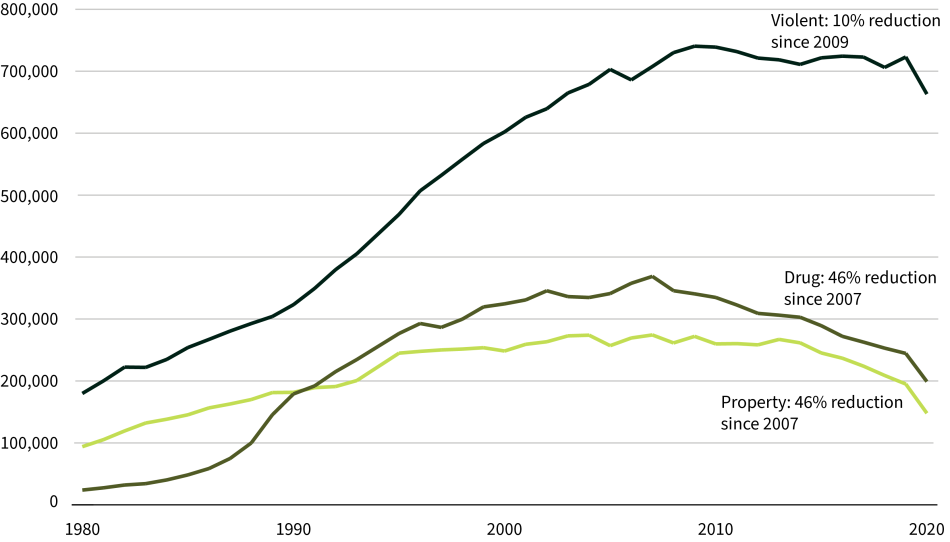
Note: Reductions are from years when the prison population for that offense category reached its peak. Chart omits public order and other/unspecified offenses, for which an additional 178,000 people were imprisoned in 2020, a 27% reduction from 2018 when that population reached its peak.
Source: Snell, T. L. (1995). Correctional populations in the United States, 1993. Bureau of Justice Statistics; Bureau of Justice Statistics Prisoners Series (1996-2021).
| Jurisdiction | Peak to 2011 | Peak Year |
|---|---|---|
| Connecticut* | -61.1% | 2007 |
| New Jersey | -60.3% | 1999 |
| New York | -58.4% | 1999 |
| Alaska*† | -49.8% | 2006 |
| Vermont* | -49.7% | 2009 |
| Rhode Island* | -48.6% | 2008 |
| Massachusetts | -46.3% | 2011 |
| Illinois | -42.3% | 2012 |
| California | -41.7% | 2006 |
| Hawaii* | -41.2% | 2005 |
| Alabama† | -38.3% | 2012 |
| Michigan | -37.6% | 2006 |
| Louisiana | -35.1% | 2012 |
| Maryland | -33.8% | 2007 |
| South Carolina | -33.7% | 2009 |
| Delaware* | -33.5% | 2007 |
| Colorado | -32.2% | 2008 |
| Washington | -30.3% | 2017 |
| Maine | -29.6% | 2007 |
| New Mexico | -29.4% | 2017 |
| Missouri | -29.1% | 2017 |
| Pennsylvania | -27.7% | 2011 |
| New Hampshire | -27.4% | 2007 |
| Federal | -26.7% | 2011 |
| Minnesota | -25.9% | 2015 |
| Nevada | -25.6% | 2017 |
| U.S. Total | -25.1% | 2009 |
| Oklahoma | -24.7% | 2016 |
| Tennessee† | -24.1% | 2017 |
| Indiana | -22.9% | 2010 |
| Mississippi | -21.8% | 2008 |
| Kentucky | -21.2% | 2017 |
| Virginia | -21.0% | 2015 |
| North Carolina | -20.7% | 2014 |
| Texas | -20.0% | 2010 |
| Arizona | -18.9% | 2015 |
| West Virginia | -18.4% | 2016 |
| Wisconsin | -17.6% | 2018 |
| Utah | -16.5% | 2013 |
| Georgia | -16.5% | 2009 |
| Wyoming | -16.5% | 2018 |
| Kansas | -15.6% | 2019 |
| South Dakota | -15.6% | 2017 |
| Ohio | -13.8% | 2015 |
| Oregon | -13.5% | 2018 |
| Iowa | -9.3% | 2018 |
| Montana | -8.7% | 2019 |
| North Dakota | -6.6% | 2015 |
| Arkansas | -5.8% | 2017 |
| Nebraska | -1.5% | 2019 |
| Idaho‡ | N/A | 2021 |
Source: Bureau of Justice Statistics Prisoners Series (1999-2021)
* Data include jail populations because prisons and jails are an integrated system in these states.
† Alabama, Alaska, and Tennessee are poised to reverse some of this progress. See page 4 for more details.
‡ Idaho changed its counting methodology in 2021, causing data incompatibility across years. In 2020, the state downsized its prisons 14% since reaching its peak level the prior year.
| 1. | Carson, E. A. (2022). Prisoners in 2021–Statistical tables. Bureau of Justice Statistics. |
|---|---|
| 2. | The U.S. prison population has grown far beyond the U.S. population, as reflected in imprisonment rates that account for total population size. The imprisonment rate grew from 93 per 100,000 residents in 1972 to 506 per 100,000 in 2008. It then declined by an average of 2.7% annually until 2021, reaching 350 per 100,000. At this rate, it would take 46 years—until 2069—to return to 1972’s imprisonment rate. See Figure 1 for source information. |
| 3. | World Prison Brief. (2023). Highest to lowest – Prison population total. Retrieved January 5, 2023, from https://www.prisonstudies.org/highest-to-lowest/prison-population-total. |
| 4. | Nellis, A. (2023). Mass incarceration trends. The Sentencing Project. |
| 5. | Ghandnoosh, N. (2021). A second look at injustice. The Sentencing Project; Ghandnoosh, N. & Nellis, A. (2022). How many people are spending over a decade in prison? The Sentencing Project. |
| 6. | While the 2020 reductions were substantial, they were insufficient against the threat that the pandemic posed to incarcerated individuals. Franco-Paredes, C., et al. (2020). Decarceration and community re-entry in the COVID-19 era. Lancet Infectious Diseases, 21(1), 11-16. https://doi.org/10.1016/S1473-3099(20)30730-1 |
| 7. | Office of Juvenile Justice and Delinquency Prevention. (2022). Highlights from the 2020 Juvenile Residential Facility Census. |
| 8. | Connecticut has an integrated jail and prison system, as do Alaska, Delaware, Hawaii, Rhode Island, and Vermont. The population counts in this brief therefore include the jail populations of these states. |
| 9. | This figure is based on the number of people serving sentences longer than one year. The Bureau of Prisons reports that the total population under its jurisdiction decreased 27% between peak year 2013 and December 29, 2022. This followed a nearly 800% increase in the federal prison population since 1980. Federal Bureau of Prisons. (2023). Statistics – Population statistics. Retrieved January 5, 2023, from https://www.bop.gov/about/statistics/population_statistics.jsp. |
| 10. | Schrantz, D., DeBor, S., & Mauer, M. (2018). Decarceration strategies: How 5 states achieved substantial prison population reductions. The Sentencing Project; Mauer, M. & Ghandnoosh, N. (2014). Fewer prisoners, less crime: A tale of three states. The Sentencing Project. |
| 11. | 2020 is the most recent year for which national crime data from the Federal Bureau of Investigation are comparable to historical data. Federal Bureau of Investigation. (2023). Crime data explorer. |
| 12. | Porter, N. (2022). Repurposing correctional facilities to strengthen communities. The Sentencing Project. |
| 13. | Lyman, B. & Roney, M. (2021, October 1). Gov. Kay lvey signs $1.3 billion prison construction bill. Montgomery Advisor. https://www.montgomeryadvertiser.com/story/news/2021/10/01/alabama-senate-approves-1-3-billion-prison-construction-bill/5934851001/; U.S. Department of Justice. (2020, December 9). Justice Department files lawsuit against the state of Alabama for unconstitutional conditions in state’s prisons for men [Press release]. https://www.justice.gov/opa/pr/justice-department-files-lawsuit-against-state-alabama-unconstitutional-conditions-states |
| 14. | Brooks, J. (2019, May 28). Alaska Senate votes to repeal and replace most of SB 91, sending crime bill to governor’s desk. Anchorage Daily News. https://www.adn.com/politics/alaska-legislature/2019/05/29/alaska-senate-votes-to-repeal-and-replace-most-of-sb-91-sending-crime-bill-to-governors-desk/ |
| 15. | Brown, M. (2022, April 21). Tennessee General Assembly passes controversial ‘truth in sentencing’ legislation. The Tennessean. https://www.tennessean.com/story/news/politics/2022/04/21/tennessee-general-assembly-passes-controversial-truth-sentencing-legislation/7400115001/ |
| 16. | See note 6. |
| 17. | Federal Bureau of Prisons (2023), see note 9 |
| 18. | The homicide rate fell from a high of 9.8 per 100,000 residents in 1991 to 5.1 in 2019 (48% decline); the rate of reported violent crimes fell from 758 per 100,000 residents in 1991 to 381 in 2019 (50% decline); the rate of reported property crimes rate fell from 5,140 per 100,000 residents in 1991 to 2,131 in 2019 (59% decline). Federal Bureau of Investigation (2023), see note 11; Doob, A., & Webster, C. (2006). Countering punitiveness: Understanding stability in Canada’s imprisonment. Law & Society Review, 40(2), 325–367. https://doi.org/10.1111/j.1540-5893.2006.00266.x; Tseloni, A., Mailley, J. & Garrell, G. (2010). Exploring the international decline in crime rates. European Journal of Criminology, 7(5), 375–394. https://doi.org/10.1177/1477370810367014. See also Thompson, A. & Tapp, S. (2022). Criminal victimization, 2021. Bureau of Justice Statistics. |
| 19. | The rate of reported violent crimes increased 5% in 2020 (increasing from 381 to 399 per 100,000 residents). The homicide rate increased 27% in 2020 (increasing from 5.1 to 6.5 per 100,000 residents), following a 2% increase in 2019. Reported rates of property crimes continued their decline in 2020 (falling 8%, from 2,131 to 1,958 per 100,000). Federal Bureau of Investigation (2023), see note 11. See also Grawert, A. and Kim, N. (2022). Myths and realities: Understanding recent trends in violent crime. Brennan Center. |
| 20. | Federal Bureau of Investigation. (2022). The Transition to the National Incident-Based Reporting System (NIBRS): A comparison of 2020 and 2021 NIBRS estimates. For preliminary 2022 figures see Rosenfeld, R., Boxerman, B. & Lopez, E. (2022). Pandemic, social unrest, and crime in U.S. cities: Mid-year 2022 update. Council of Criminal Justice. |
| 21. | John Jay College Research Advisory Group on Preventing and Reducing Community Violence. (2020). Reducing violence without police: A review of the research evidence. John Jay College of Criminal Justice; Sebastian, T., et al. (2022) A new community safety blueprint: How the federal government can address violence and harm through a public health approach. Brookings; Doleac, J. (2018). New evidence that access to health care reduces crime. Brookings. |
| 22. | Ghandnoosh, N. (2019). The next step: Ending excessive punishment for violent crimes. The Sentencing Project; Carson (2022), see note 1. |
| 23. | Federal Bureau of Investigation (2023), see note 11. |
| 24. | Ghandnoosh & Nellis (2022), see note 5. |
| 25. | Ghandnoosh & Nellis (2022), see note 5; Nellis, A. (2021). No end in sight: America’s enduring reliance on life imprisonment. The Sentencing Project. |
| 26. | Nellis (2021), see note 25. |
| 27. | Ghandnoosh & Nellis (2022), see note 5. |

