Tribal Disparities in Youth Incarceration
Disparities in tribal youth incarceration have grown worse over the course of the decade, with tribal youth being almost four times as likely to be incarcerated than their white peers.
Related to: Youth Justice, Racial Justice
Incarceration disparities between Tribal and white youth have increased over the past decade. As of 2023, the most recent year for which data are available, Tribal youth were 3.8 times as likely to be placed in juvenile facilities (i.e., detained or committed) as their white peers. The disparity is now at an all-time high, based on data that starts in 1997.1
Juvenile facilities held 29,314 youth as of October 2023. This includes placement in one of our nation’s 1,277 detention centers, residential treatment centers, group homes, and youth prisons.2 These numbers do not include the 437 people under age 18 in adult prisons at year-end 2022 or the estimated 2,000 people under 18 in adult jails at midyear 2023.3
- Nationally, the youth placement rate was 87 per 100,000 youth.
- Tribal youth were placed at a rate of 199 per 100,000, compared to the white youth rate of 52 per 100,000.
Among the 17 states with a population of at least 5,000 Tribal youth between ages 10 and 17, a cutoff that allows for meaningful comparisons, Tribal youth were at least twice as likely to be in custody than white youth in 10 states.
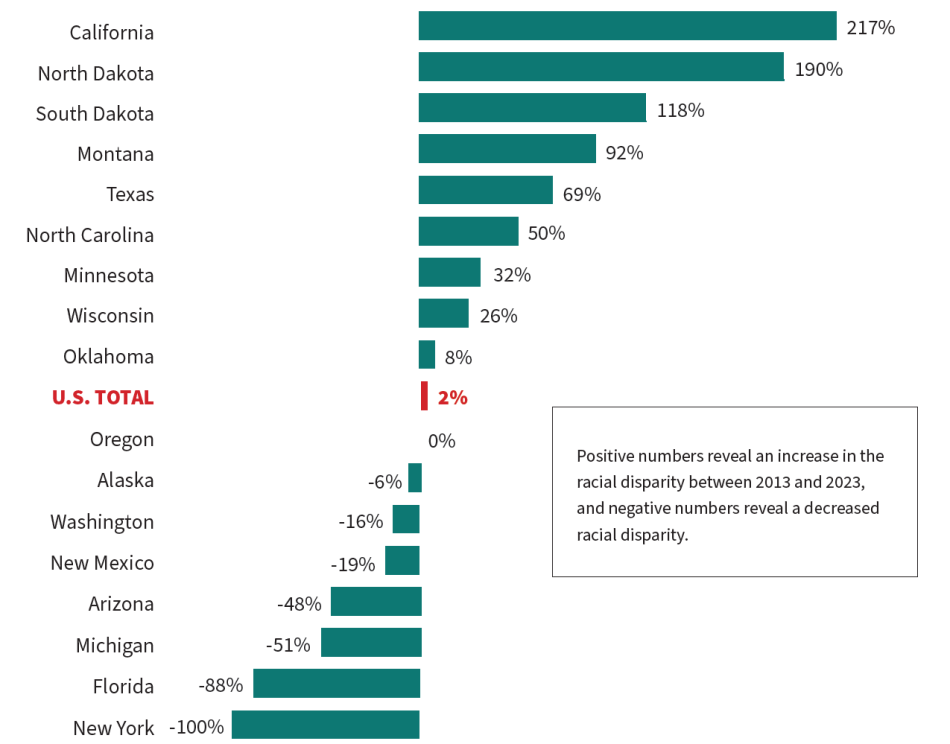
Over the last 10 years for which there are data, juvenile placements fell 46%. During this same period, Tribal-white racial disparities in youth incarceration grew more than 10% in eight states (among those with significant Tribal populations) and decreased by at least 10% in six states. Other trends during this period include:
- California, North Dakota, and South Dakota saw their racial disparity at least double.
- New York, Florida, and Michigan decreased their racial disparity by at least half.
Tribal youth were at least 10 times as likely to be held in placement as white youth in Minnesota, North Dakota, South Dakota, and Wisconsin.
| State | Tribal Rate | White Rate | T/W Disparity |
|---|---|---|---|
| Alaska | 486 | 179 | 2.7 |
| Arizona | 49 | 42 | 1.2 |
| California | 270 | 33 | 8.2 |
| Florida | 69 | 72 | 1.0 |
| Michigan | 54 | 40 | 1.4 |
| Minnesota | 640 | 32 | 20.0 |
| Montana | 356 | 65 | 5.5 |
| New Mexico | 62 | 114 | 0.5 |
| New York | 0 | 21 | 0.0 |
| North Carolina | 80 | 18 | 4.4 |
| North Dakota | 302 | 19 | 15.9 |
| Oklahoma | 56 | 30 | 1.9 |
| South Dakota | 724 | 54 | 13.4 |
| Texas | 40 | 63 | 0.6 |
| Washington | 182 | 46 | 4.0 |
| Wisconsin | 329 | 31 | 10.6 |
| U.S. Total | 199 | 52 | 3.8 |
The table above and the figure below are limited to the 17 states with at least 5,000 Tribal residents between 10- and 17-years old. Numbers in the third column reveal the extent to which Tribal youth are incarcerated relative to white youth. For example, in Alaska, Tribal youth are 2.7 times as likely to be held in a juvenile facility as their white peers. A number less than 1 reflects a reverse disparity, wherein white youth are more likely to be in placement than their Tribal peers.
Change in Tribal/White Placement Disparity; 2013 vs. 2023
| 1. | Puzzanchera, C., Sladky, T.J., and Kang, W. (2025). Easy access to the census of juveniles in residential placement. National Center for Juvenile Justice. |
|---|---|
| 2. | Puzzanchera, C., Hockenberry, S., Sladky, T.J., and Kang, W. (2024). Juvenile residential facility census databook. National Center for Juvenile Justice. |
| 3. | Carson, E.A., and Kluckow, R. Prisoners in 2022 – Statistical tables (Table 15). Bureau of Justice Statistics. Zeng, Z. (2025). Jail inmates in 2023 – Statistical tables (Table 4). Bureau of Justice Statistics. |

