Locked Out 2022: Estimates of People Denied Voting Rights
An estimated 4.4 million Americans are barred from voting due to a felony conviction.
Related to: Voting Rights

Overview
Laws in 48 states ban people with felony convictions from voting. In 2022, an estimated 4.4 million Americans, representing 2 percent of the voting-age population, will be ineligible to vote due to these laws or policies, many of which date back to the post-Reconstruction era. In this election year, as the United States confronts questions about the stability of its democracy and the fairness of its elections, particularly within marginalized communities, the impact of voting bans on people with felony convictions should be front and center in the debate.
This 2022 report updates and expands upon 20 years of work chronicling the scope and distribution of felony disenfranchisement in the United States (see Uggen, Larson, Shannon, and Pulido-Nava 2020; Uggen, Larson, and Shannon 2016; Uggen, Shannon, and Manza 2012; Manza and Uggen 2006; Uggen and Manza 2002). As in 2020, we present national and state estimates of the number and percentage of people disenfranchised due to felony convictions, as well as the number and percentage of the Black and Latinx populations impacted. Although these and other estimates must be interpreted with caution, the numbers presented here represent our best assessment of the state of felony disenfranchisement as of the November 2022 election.
Among the report’s key findings:
- An estimated 4.4 million people are disenfranchised due to a felony conviction, a figure that has declined by 24 percent since 2016, as more states enacted policies to curtail this practice and state prison populations declined modestly. Previous research finds there were an estimated 1.2 million people disenfranchised in 1976, 3.3 million in 1996, 4.7 million in 2000, 5.4 million in 2004, 5.9 million in 2010, 6.1 million in 2016, and 5.2 million in 2020.
- One out of 50 adult citizens – 2 percent of the total U.S. voting eligible population – is disenfranchised due to a current or previous felony conviction.
- Three out of four people disenfranchised are living in their communities, having fully completed their sentences or remaining supervised while on probation or parole.
- In two states – Alabama and Tennessee – more than 8 percent of the adult population, one of every 13 adults, is disenfranchised.
- Florida remains the nation’s disenfranchisement leader in absolute numbers, with over 1.1 million people currently banned from voting, often because they cannot afford to pay court-ordered monetary sanctions. An estimated 934,500 Floridians who have completed their sentences remain disenfranchised, despite a 2018 ballot referendum that promised to restore their voting rights.
- One in 19 African Americans of voting age is disenfranchised, a rate 3.5 times that of non-African Americans. Among the adult African American population, 5.3 percent is disenfranchised compared to 1.5 percent of the adult non-African American population.
- More than one in 10 African American adults is disenfranchised in seven states – Alabama, Arizona, Florida, Kentucky, South Dakota, Tennessee, and Virginia.
- Although data on ethnicity in correctional populations are unevenly reported and undercounted in some states, a conservative estimate is that at least 506,000 Latinx Americans or 1.7 percent of the voting eligible population are disenfranchised.
- Approximately 1 million women are disenfranchised, comprising over one-fifth of the total disenfranchised population.
State Disenfranchisement Reforms
To compile estimates of disenfranchised populations, we take into account new U.S. Census data on voting eligible populations1 and recent changes in state-level disenfranchisement laws and policies, including those reported in Felony Disenfranchisement: A Primer (Chung 2019) and Expanding the Vote (Porter 2010; McLeod 2018). Since January 1, 2020, laws or policy changes took effect in 8 states, expanding voting rights to some nonincarcerated people: California (parole), Connecticut (parole), Iowa (post-sentence, with exception for homicide), New Jersey (probation and parole), New York (parole), North Carolina (probation and parole), Virginia (post-prison), and Washington (post-prison). Other states have revised their waiting periods and streamlined the process for regaining civil rights. In November 2018, Florida voters passed Amendment 4 to the Constitution of Florida by ballot initiative, which allowed most people who have completed their sentences to vote (with the exception of people convicted of sex offenses and murder). In 2019, however, the Florida legislature passed and the Governor signed Senate Bill 7066, restricting the voting rights of people who had not paid court-ordered monetary sanctions, and effectively “redisenfranchising” the majority of those whose rights were restored by Amendment 4.
As shown in Table 1, Maine and Vermont remain the only states that allow persons in prison to vote (as well as the District of Columbia and the Commonwealth of Puerto Rico). Twenty-six U.S. states deny voting rights to people on felony-level probation or parole. In the most extreme cases, 11 states continue to deny voting rights to some or all of the individuals who have successfully fulfilled their prison, parole, or probation sentences.
| No restrictions (2) | Prison only (22) | Prison, parole, & probation (15) | Prison, parole, probation, & post-sentence (11) |
|---|---|---|---|
| Maine | California (3) | Alaska | Alabama (1) |
| Vermont | Colorado | Arkansas | Arizona (2) |
| Connecticut (4) | Georgia | Delaware (5) | |
| Hawaii | Idaho | Florida (6) | |
| Illinois | Kansas | Iowa (7) | |
| Indiana | Louisiana (9) | Kentucky (8) | |
| Maryland | Minnesota | Mississippi (10) | |
| Massachusetts | Missouri | Nebraska (11) | |
| Michigan | New Mexico | Tennessee (14) | |
| Montana | Oklahoma | Virginia (15) | |
| Nevada | South Carolina | Wyoming (17) | |
| New Hampshire | South Dakota | ||
| New Jersey | Texas | ||
| New York (12) | West Virginia | ||
| North Carolina (13) | Wisconsin | ||
| North Dakota | |||
| Ohio | |||
| Oregon | |||
| Pennsylvania | |||
| Rhode Island | |||
| Utah | |||
| Washington (16) |
Notes regarding recent changes and state-specific post-sentence disenfranchisement rules:
- Alabama – In 2016, legislation eased the rights restoration process after completion of sentence for persons not convicted of a
crime of “moral turpitude.” The state codified the list of felony offenses that are ineligible for re-enfranchisement in 2017. - Arizona – Permanently disenfranchises persons with two or more felony convictions. In 2019, removed the requirement to pay
outstanding fines before rights are automatically restored for first time felony offenses only. - California – In 2020, California Proposition 17 was approved and restored voting rights to people on parole.
- Connecticut – In 2021, Gov. Ned Lamont signed legislation restoring voting rights to people on parole. Connecticut does
disenfranchise parolees and felony probationers convicted of election-related offenses. - Delaware – In 2013, removed the five-year waiting period to regain voting eligibility. Apart from some disqualifying offenses, people convicted of a felony are now eligible to vote upon completion of sentence and supervision.
- Florida – In 2018, voters passed an amendment to restore voting rights to most people after sentence completion. In 2019,
legislation was passed that made restoration conditional on payment of all restitution, fees, and fines. As of October 2020, only the rights of those who had paid all legal financial obligations (fines and fees) had been restored. - Iowa – In 2020, Governor Reynolds signed an executive order restoring voting rights to people who have completed their sentences, except for those convicted of homicide. This follows previous executive orders from Governor Vilsack (restoring voting rights to individuals who had completed their sentences in 2005) and Governor Branstad (reversing this executive order in 2011).
- Kentucky – In 2019, Governor A. Beshear issued an executive order restoring voting rights to those who had completed sentences for nonviolent offenses. This follows a similar 2015 executive order by Governor S. Beshear, which had been rescinded by Governor Bevin later that year.
- Louisiana – In 2019, House Bill 265 went into effect, restoring voting rights for residents serving probation or parole sentences
who have not been incarcerated within the past five years. Some sources count Louisiana among the states that have fully reenfranchised people on probation (see, e.g., https://www.voiceoftheexperienced.org/voting-rights, although most interpret
Louisiana’s law as continuing to restrict the voting rights of a small percentage of Louisiana’s current probation population). - Mississippi – Permanently disenfranchises individuals convicted of certain offenses.
- Nebraska – In 2005, reduced its indefinite ban on post-sentence voting to a two-year waiting period.
- New York – In 2021, Governor Cuomo signed legislation restoring voting rights automatically upon release from prison.
- North Carolina – After a series of court rulings, people who are not serving felony sentences in jail or prison may register to vote
as of July 27, 2022. Further appeals are pending. See https://appellate.nccourts.org/dockets.php?court=1&docket=1-2021-0331-
001&pdf=1&a=0&dev=1 - Tennessee – Disenfranchises those convicted of certain felonies since 1981, in addition to those convicted of select crimes prior to 1973. Others must apply to the Board of Probation and Parole for restoration.
- Virginia – In 2020, an Executive Order automatically restored voting rights for many people upon release from prison and provided an application process for restoration as long as not incarcerated for a felony conviction.
- Washington – In 2021, Governor Inslee signed legislation restoring voting rights to people convicted of felonies automatically after release from prison.
- Wyoming – In 2017, restored voting rights after five years to people who complete sentences for first-time, non-violent felony
convictions.
Methodology
We estimated the number of people released from prison and those who have completed their terms of parole or probation based on demographic life tables for each state, as described in Uggen, Manza, and Thompson (2006) and Shannon et al. (2017). We modeled each state’s disenfranchisement rate in accordance with its distinctive felony voting laws and policies, as listed in Table 1. For example, some states impose disenfranchisement for two years after release from supervision, some states only disenfranchise
those convicted of multiple felonies, and some only disenfranchise those convicted of violent offenses.2
In brief, we compiled demographic life tables for the years 1948-2022 to determine the number of released individuals lost to recidivism (and therefore already included in our annual head counts) and to mortality each year. This allows us to estimate the number of individuals who have completed their sentences in a given state and year who are no longer under correctional supervision yet remain disenfranchised. Our duration-specific recidivism rate estimates are derived from large-scale national studies of recidivism for people released from prison (e.g., Antenangeli and Durose 2021 and previous USDOJ reports in this series) and people leaving probation (e.g., USDOJ 1992). Based on these studies, our models assume that most released individuals will be re-incarcerated (66 percent) and a smaller percentage of those on probation or in jail (57 percent) will return through the criminal legal system. We also assume a substantially higher mortality rate for people convicted of felony offenses relative to the rest of the population. Both people returning to the system and deaths are removed from the post-sentence pool to avoid overestimating the number of individuals in the population who have completed their sentences. Each release cohort is thus reduced each successive year – at a level commensurate with the age-adjusted hazard rate for mortality and duration-adjusted hazard rate for recidivism – and added to each new cohort of releases. Overall, we produced more than 200 spreadsheets covering 76 years of data.3 These provide the figures needed to compile disenfranchisement rate estimates that are keyed to the appropriate correctional populations for each state and year.4 5 6
The disenfranchisement of incarcerated people is one of the biggest obstacles to criminal justice reform that our country faces. When an individual is behind bars, they are effectively voiceless. They do not have the ability to change the system that has harmed them. But by giving people behind the wall an opportunity to cast their ballot, we can give them their voice back. We can give them a say in the system that has led to their own imprisonment.

Disenfranchisement in 2022
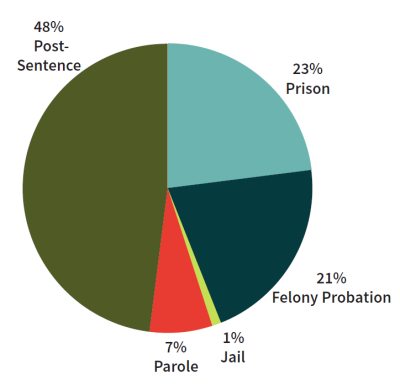
Figure 1 shows the distribution of the 4.4 million disenfranchised individuals across correctional populations estimated. More than three out of four people disenfranchised are living in their communities, either while supervised on probation or parole or after having fully completed their sentences. The largest proportion of the disenfranchised population, almost half (48%) have fully completed their sentence. People currently in prison and jail now represent about 24 percent of those disenfranchised. The data reported are based on estimates, rather than head counts and population counts in prison, probation, and parole, as such counts have been exceptionally unstable during the Covid-19 pandemic.
Figure 1. Disenfranchisement Distribution Across Correctional Populations, 2022
Variation Across States
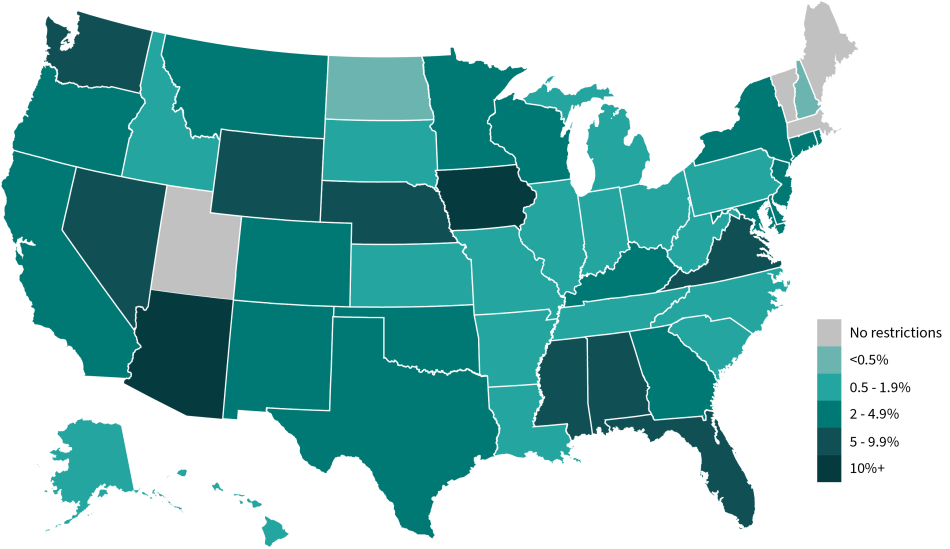
Due to differences in state laws and policies and rates of criminal punishment, states vary widely in the practice of disenfranchisement. These maps and tables represent the disenfranchised population as a percentage of the adult voting eligible population in each state. As noted, we estimate that almost 4.4 million Americans are currently barred from voting by state law and policy. As Figure 2 and the statistics in Table 2 show, state-level disenfranchisement rates in 2022 varied from 0.15 percent in Massachusetts (and zero in Maine and Vermont) to more than 8 percent in Alabama, Mississippi, and Tennessee.
Figure 2. Total Felony Disenfranchisement Rates, 2022
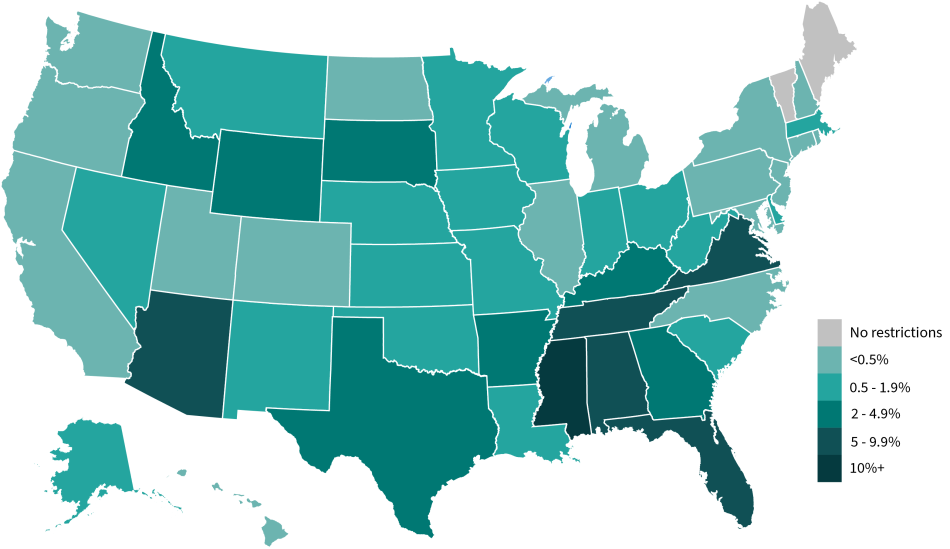
See the note on Mississippi at the top of the webpage.
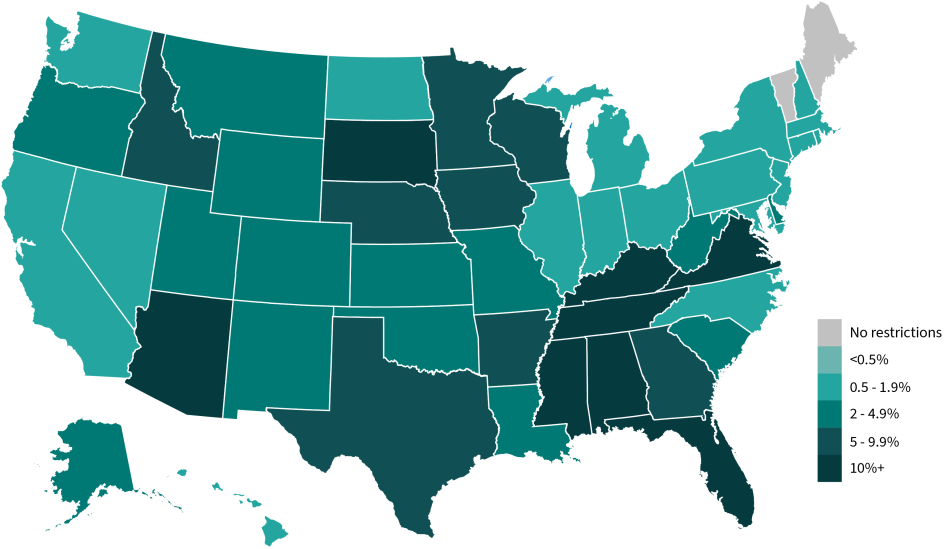
These figures reflect significant but uneven change in recent decades. Although half of the states have scaled back voting restrictions for people with felony convictions, several others – particularly Southeastern states – have retained such restrictions and their disenfranchised populations have increased commensurate with the expansion of the criminal legal system. Figure 3 displays disenfranchisement rates in 1980, when the national disenfranchisement rate was 1.0 percent. At that time, far more of the nation had disenfranchisement rates of approximately 0.5 percent. Alabama had the nation’s highest rate of disenfranchisement at just under 5 percent, but no state disenfranchised more than 5 percent of its adult citizens.
Figure 3. Total Felony Disenfranchisement Rates, 1980
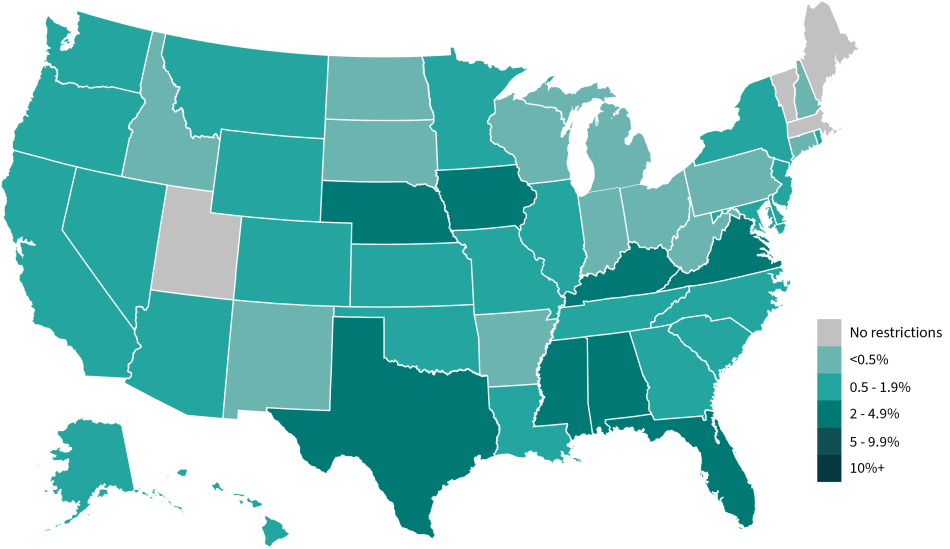
See the note on Mississippi at the top of the webpage.
The cartogram in Figure 4 provides another way to visualize the impact of these policies by highlighting the large regional differences in felony disenfranchisement laws and policies. Cartograms distort the land area on the map under an alternative statistic, in this case the total felony disenfranchisement rate. Southeastern states appear bloated because they disenfranchise hundreds of thousands of people who have completed their sentences. In contrast, many Northeastern and Midwestern states shrink because they limit disenfranchisement to individuals currently in prison, or not at all. This distorted map thus provides a clear visual representation of the great range of differences and regional variation in the scope and impact of felony disenfranchisement across the 50 states.
Figure 4. Cartogram of Total Disenfranchisement Rates by State, 2022
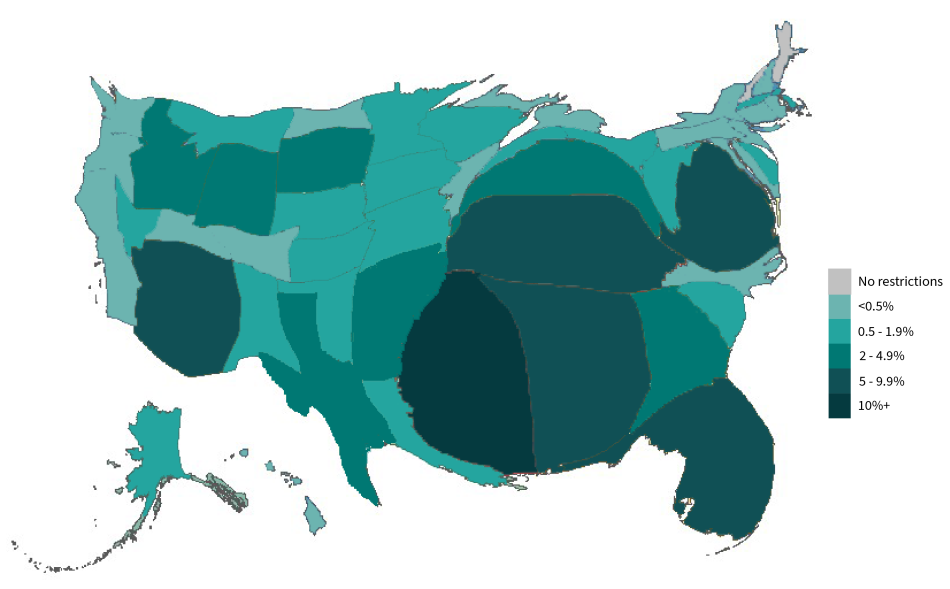
See the note on Mississippi at the top of the webpage.
Trends Over Time
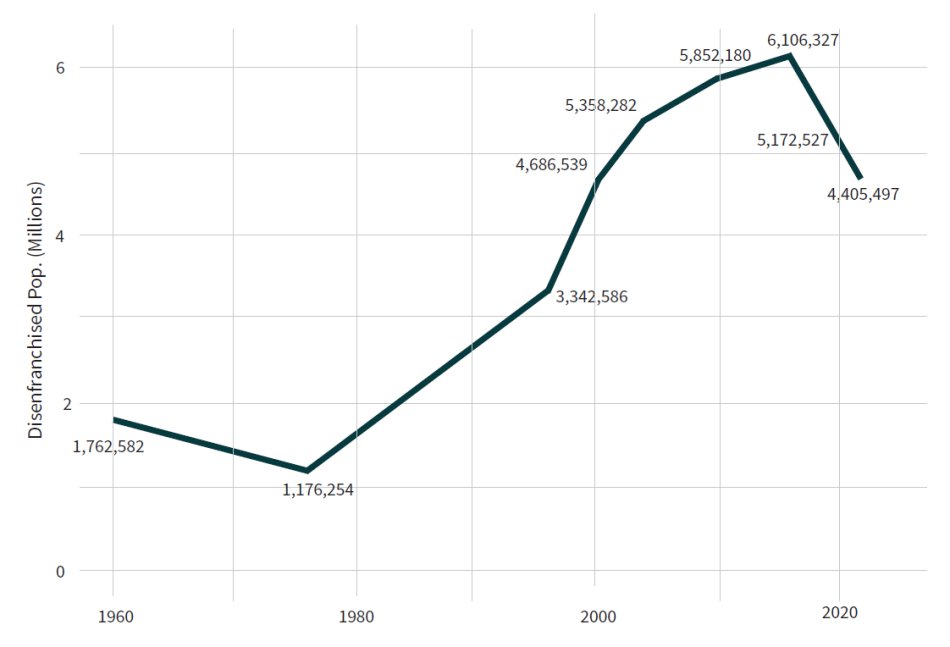
Figure 5 illustrates the historical trend in U.S. disenfranchisement resulting from a felony conviction, showing growth in the disenfranchised population for selected years from 1960 to 2022. The number disenfranchised dropped from approximately 1.8 million to 1.2 million between 1960 and 1976, as states expanded voting rights in the civil rights era. Many states have pared back their disenfranchisement provisions since the 1970s (see Behrens, Uggen, and Manza, 2003; Manza and Uggen, 2006), a trend that has accelerated in the past 5 years. The total disenfranchised population rose from 3.3 million in 1996 to 4.7 million in 2000, to 5.4 million in 2004, to 5.9 million in 2010, and 6.1 million in 2016. Today, we estimate that over 4.4 million Americans are disenfranchised by virtue of a felony conviction. Roughly the same number of voters will be disenfranchised in the 2022 election as in 2000 – a closely contested presidential election that drew national attention to the disenfranchisement of people with felony-level criminal records in Florida and across the country (Uggen and Manza 2002; but see Burch 2012; Klumpp et al. 2019).
Figure 5. Number Disenfranchised for Selected Years, 1960-2022
Variation by Race and Ethnicity
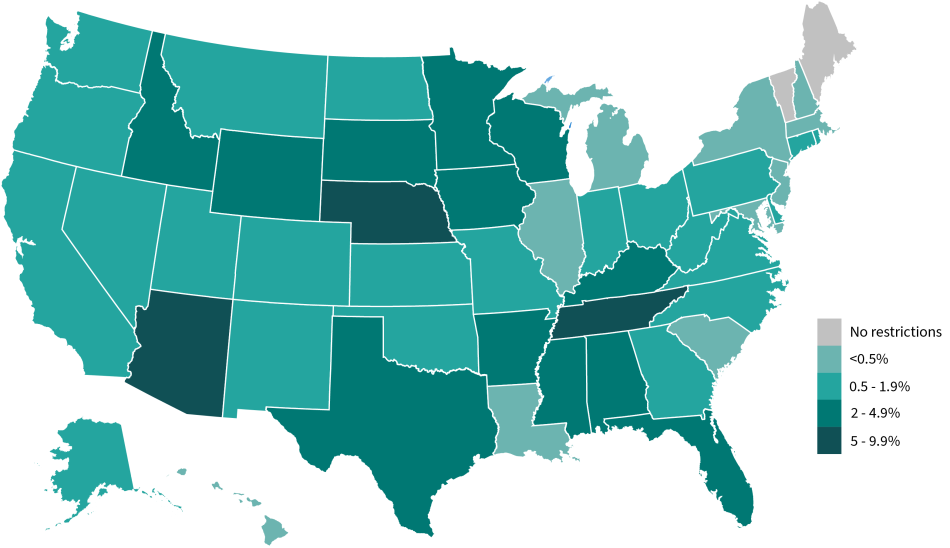
Disenfranchisement rates vary widely across racial and ethnic groups, such that felony disenfranchisement provisions have an outsized impact on communities of color. Ethnicity data in particular have not been consistently collected or reported in the data sources used to compile our estimates, so our ability to construct these estimates is limited. This is especially the case for Latinx populations, who now constitute a significant portion of criminal justice populations. Race data on criminal justice populations is more complete, and we have used the most recent data available from the Bureau of Justice Statistics to develop a complete set of state-specific disenfranchisement estimates for the African American voting eligible population (Figures 6 and 7). We first show a map of the African American disenfranchisement rate for 1980, and then show how the picture looks today. By 1980, the African American disenfranchisement rate already exceeded 10 percent of the adult population in states such as Arizona and Iowa, as shown in Figure 6. The figure also indicates that several Southeastern states disenfranchised more than 5 percent of their adult African American populations at that time.
Figure 6. African American Felony Disenfranchisement Rates, 1980
See the note on Mississippi at the top of the webpage.
Figure 7 shows the corresponding rates for 2022, again retaining a common scale and shading to keep the map consistent with the 1980 map (Figure 6). African American disenfranchisement rates in Tennessee and Mississippi now exceed 15 percent of the adult voting eligible population. Whereas 9 states disenfranchised at least 5 percent of their African American adult citizens in 1980, 17 states do so today.
Figure 7. African American Felony Disenfranchisement Rates, 2022
See the note on Mississippi at the top of the webpage.
Data are limited regarding ethnicity, but more states are now consistently reporting Latinx ethnicity for justice-involved populations. We therefore compiled estimates for these populations but present them with the caveat that these figures likely undercount the true rate of Latinx disenfranchisement in many states. Although data on Latinx ethnicity in correctional populations are still unevenly reported, we can conservatively estimate that at least 506,000 Latinx Americans (1.7 percent of the voting eligible population) are disenfranchised. In Arizona and Tennessee over 6 percent of Latinx voters are disenfranchised due to felony-level convictions. Even with the likely undercounting, 31 states report a higher rate of disenfranchisement in the Latinx population than in the general population. Many of those disenfranchised today were convicted at a time when the Latinx population was significantly smaller than it is today. Because the overall U.S. Latinx population has quadrupled since 1980, we anticipate that Latinx disenfranchisement will comprise an increasing share of those disenfranchised due to felony convictions in coming years.
Figure 8. Latinx Felony Disenfranchisement Rates (Available Data), 2022
See the note on Mississippi at the top of the webpage.
Sex and Disenfranchisement
To estimate the percentage of disenfranchised male and female voters, we compiled national prison, probation, parole and jail statistics, and prepared a national life table to obtain the post-sentence gender distribution. By this method, we estimate that approximately 1.0 million women are disenfranchised in 2022, making up over one-fifth of the total disenfranchised population.
Every single day in U.S. jails and prisons, women are subjected to or witness verbal, physical, and sexual abuse. There are systems in place that are supposed to address these issues, but nevertheless, these incidents continue. It often seems that our system is entirely fixated on how much punishment can be meted out on each individual person. The only way to upset this system is to connect those most impacted by it – incarcerated people – to their elected officials via the ballot. That ability to vote gives them the power they need to change an unjust system. It gives them a say in the conditions in which they live.

Recent Changes
The total disenfranchisement rate in 2022 (1.99 percent) shows a decline relative to the figures our team reported in 2020 (2.27 percent) and 2016 (2.47 percent), due largely to state changes in disenfranchisement laws and policies but also in part due to the decline in state prison and jail populations during the Covid-19 pandemic. Our estimates for African American disenfranchisement in 2022 are also lower than for previous years: 5.28 percent, versus 6.26 percent in 2020, 7.44 percent in 2016, 7.66 percent in 2010, and 8.25 percent in 2004. For the 2022 estimates, we used American Community Survey data to obtain denominators for the African American voting eligible population. Our estimates are based on race-specific recidivism rates that reflect current scholarship on punishment and recidivism. This results in a higher rate of attrition in our life tables, but produces a more conservative and, we believe, more accurate portrait of the number of disenfranchised African Americans. Though lower than in previous years, the 5.3 percent rate of disenfranchisement for African Americans remains 3.5 times that of the non-African American rate of 1.5 percent.
Florida deserves special mention, in light of the size of its disenfranchised population and the scope of recent legal and policy changes in that state. In 2018, Florida voters approved Amendment 4, which restored voting rights to people who had completed their sentences. The following year, however, Senate Bill 7066 was signed into law, conditioning restoration of voting rights on payment of outstanding monetary sanctions. Firm estimates are therefore more difficult to produce for Florida than for other states. Based on our assumptions regarding the share of post-sentence residents with outstanding legal financial obligations (fines, fees, and restitution), we estimate that over 934,500 people who have completed their sentence remain disenfranchised in that state.7
As detailed in the notes to Table 1, there have been numerous other significant changes in state disenfranchisement laws and policies since our last report in 2020. Since January of that year, law and policy changes have been implemented in at least 8 states, restoring the vote to people currently on probation and parole in New Jersey, North Carolina, and Washington; to people on parole in California, Connecticut, and New York; and to many people who had completed their sentences in Virginia and Iowa.
Restoration of Voting Rights Since 2020 Report
Apart from legal changes that have re-enfranchised people whose convictions or supervision status meet certain criteria, states also provide some limited mechanism for disenfranchised persons to restore their right to vote. These vary greatly in scope, eligibility requirements, and reporting practices. It is thus difficult to obtain consistent information about the rate and number of disenfranchised Americans whose rights are restored through these generally administrative procedures. Nevertheless, as we have done in previous reports, we contacted each of the appropriate state agencies by email and phone and compiled the information they made available to us. We then subtracted all known restorations of civil rights (including full pardons) from each state’s total disenfranchised post-sentence figure in each of the 11 states that disenfranchise beyond sentence completion. Even accounting for these restorations, it is clear that those whose rights are restored by these processes represent a relatively small fraction of the total disenfranchised population in most states (for previous years, see Uggen, Larson, and Shannon, 2016; Uggen, Larson, Shannon, and Pulido-Nava 2020).8
After surviving 28 years in prison, I am a clemency recipient. I will be able to vote for the first time in the midterm election. Participating in voting makes me feel like I’m a part of my community, like I belong here.

Outstanding Monetary Sanctions
In addition to Florida, other states partly condition re-enfranchisement on payment of outstanding fines, fees, court costs, and restitution. With regard to the categories in Table 1, Margaret Love and David Schlussel (2020) note that Arkansas, Connecticut, Kansas, South Dakota, and Texas appear to disenfranchise some people post-sentence, on the basis of unpaid legal financial obligations. They also identify Georgia in this category, but the Georgia Secretary of State’s office clarified in 2020 that anyone who has completed their sentence, even if they owe outstanding monetary debt, can vote (Niesse 2020). According to the Georgia Secretary of State’s Office, fines that were a condition of probation are automatically cancelled upon completion of probation. Arkansas requires payment of court costs, fines, and restitution; South Dakota requires payment of fines, fees, and restitution; and Texas requires payment of fines. Three states in addition to Florida condition eligibility for re-enfranchisement on payment of some or all legal financial obligations. Alabama conditions re-enfranchisement after a first felony on payment of fines, fees, court costs, and victim restitution; Arizona conditions restoration after a first felony on payment of restitution; and Tennessee conditions restoration on payment of restitution, court costs (unless a finding of indigency was made), and child support. Kentucky requires repayment of restitution to be eligible to apply for restoration of civil rights. Iowa conditions eligibility for re-enfranchisement for people convicted of homicide crimes before July 4, 2005 on repayment of court costs, restitution, and fines (or being current on a payment plan). The scope and enforcement of such restrictions varies greatly across these states, such that we cannot provide firm estimates on the number of people impacted. Nevertheless, they could serve as an additional driver of disenfranchisement, above and beyond the restrictions reported in Table 1 and the numbers reported in Tables 2, 3, and 4.
Immigration Status
The figures we present include estimates of the number and percentage of people disenfranchised due to a felony conviction, although some people are also ineligible to vote for other reasons, including immigration status. We lack good data on the number of people who are ineligible to vote due to both conviction status and immigration status, but current prison populations provide a baseline to estimate the magnitude of this population. As of December 31, 2020, 45 states and the Federal Bureau of Prisons reported that 58,100 non-U.S. citizens were held in state or federal U.S. prisons (USDOJ, 2021). This represents about 4.9 percent of the total state and federal prison population (1,215,800) on this date. About half of this number (24,000) were held in federal institutions and an additional 17,400 were in custody in four states (Texas, Florida, Arizona, and Georgia).
Prosecuted for Voting
Alongside movements to limit the expansion of voting rights restoration in recent years, some states have also demonstrated a renewed interest in prosecuting people for voting while ineligible because of a felony conviction. Florida, for example, established a new election crime and security unit in July 2022, announcing the impending arrest of 20 individuals for voting while they were under supervision in 2020 (Lopez 2022; Office of Governor Ron DeSantis 2022; Rozsa and Craig 2022).
But recent cases have demonstrated how confusing disenfranchisement laws and policies can be for both voters and government officials. The prosecution of Crystal Mason, a Black woman in Texas, was in the national spotlight when she was sentenced to five years in prison after being convicted of attempting to vote while ineligible.9 Mason was serving a supervised release sentence after her release from prison for felony tax fraud when she cast a provisional ballot in the 2016 election. Throughout the trial, Mason maintained she did not know she was ineligible to vote, and her probation officer acknowledged he never told Mason she was ineligible. Mason appealed her conviction, and in May 2022 the Texas Court of Criminal Appeals found that the trial court “erred by failing to require proof that the Appellant had actual knowledge that it was a crime for her to vote while on supervised release” and sent the case back for review.10
In a more recent case in Tennessee, a Black Lives Matter activist named Pamela Moses was convicted of illegally registering to vote and sentenced to six years in prison (Medina 2022).11 In 2019, believing she had completed her felony probation from a prior tampering with evidence conviction, Moses decided to run for office (Levine 2022). But when election officials told her she was not eligible because of her felony, she first went to the court and later to her probation office to determine her status. The court told her she was still on probation, but her probation office provided Moses with a signed certificate of restoration confirming she had completed her sentence and her rights had been restored,12 which Moses submitted when she registered at the local election office (Levine 2022). However, both Moses and the probation office were mistaken as Moses was still on court-ordered probation.13 Further, the confusing nature of Tennessee’s disenfranchisement laws and policies was on display when her probation officer and the probation supervisor acknowledged at trial they were unaware that Moses’ prior tampering conviction was one of the few felony convictions in Tennessee that made her ineligible for restoration of voting rights. As seen in this transcript excerpt from the trial,14 the trial judge echoed this confusion:
PROSECUTOR: …The tampering with evidence we’re addressing today, which is permanent. I don’t remember all the ones. I know murder, probably rape–
THE COURT: That’s something I didn’t know. Are you telling me if you get convicted of tampering with evidence, you can never vote?… Where is that in the law?
….
DEFENSE: It’s titled– …. I think it’s 39-15 or 39-17 where it talks about the interference with government operations. Those are–
….
PROSECUTOR: It’s 40-29-204.
….
THE COURT: “Those convicted after July 1, 1996, but before July 1, 2006–those convicted after July 1, 2006, any of the offenses set forth in one and two above, voter fraud, treason, murder in the first degree, aggravated rape.” And then it goes on to say, “Any other violation of title chapter part one, four, and five, designated as a felony”– so are you telling me I’ve got to go back and look at 39-16?
….
PROSECUTOR: Yes. Now you have to, and that’s where the tampering with evidence, along with–it falls under, like, bribery, contraband, false pretense, the ones that are felonies.
To be sure, these cases are not typical, and there is no empirical evidence that voting or registering while ineligible is anything but rare (Levitt 2007; Minnite 2010). Yet prosecutions for voting while ineligible may have a chilling effect on political participation more generally, with the potential to intimidate recently re-enfranchised voters and suppress the vote.
This practice is not unique to the aforementioned states. For example, our team conducted an original analysis of sentencing data of all voting or registering while ineligible convictions in Minnesota from 2000 to 2019 (Uggen and Stewart 2022). In that period spanning five presidential elections, 243 people were convicted of voting while ineligible (or 0.0008% out of 28,662,749 votes cast) and 134 were convicted of registering while ineligible. The majority of the prosecutions (147) came after the 2008 election, following an effort by a now-defunct local voter integrity organization to prove massive voter fraud. The organization identified 2,803 people they suspected of having voted illegally to county attorneys throughout the state, but prosecutors determined that 95 percent of these were either eligible to vote or there was not enough evidence to pursue charges. Compared to the Minnesotans convicted of all felony crimes, those convicted of voting or registering illegally were more likely to be women (32% versus 21%) and far more likely to be Black (38% versus 23%). One individual had served 9 years and 10 months of a 10-year probation sentence when he was charged with a new felony for voting. Others had been on probation for a decade or more. Many of those charged in Minnesota were on probation for lower-level offenses, such as drug possession, theft, writing bad checks, and violation of public assistance rules. Such aggressive prosecution for voting while ineligible may represent a form of “democratic backsliding” in some states (see, e.g., Grumbach 2022) – one made possible by broad restrictions on the rights of people with criminal records.
Summary
This report provides new state-level estimates on felony disenfranchisement for 2022 and updates those provided by Uggen, Larson, and Shannon (2020) for previous years. In Tables 2, 3, and 4, we provide state-specific point estimates of the total disenfranchised population, the African American disenfranchised population, and the Latinx disenfranchised population, subject to the caveats described below.
Despite significant legal changes in recent decades, and declining state prison and jail populations during the Covid-19 pandemic, about 4.6 million Americans are disenfranchised due to criminal convictions in 2022. This number has declined an impressive 24 percent since 2016, when 6.1 million were disenfranchised. Levels of disenfranchisement today are closer in absolute number to the 4.69 million who were denied the vote in 2000, when disenfranchisement may have played an important part in a closely contested presidential election. When we break these figures down by race and ethnicity, it is clear that disparities in the criminal justice system are linked to disparities in political representation, as 5.3 percent of the African American voting eligible population is currently disenfranchised due to a felony conviction. The distribution of disenfranchised individuals shown in Figure 1 also bears repeating: less than one-fourth of this population is currently incarcerated, and over 3.5 million adults who live in their communities are banned from voting. The significant reforms implemented in the past six years have helped to restore the rights of almost 1.5 million voters, yet 4.6 million still remain locked out.
Understanding the Numbers and Assumptions
We have taken care to produce estimates of current populations and “post-sentence” populations that are reliable and valid by social science standards. Nevertheless, readers should bear in mind that our state-specific figures for the 11 states that bar individuals from voting after they have completed their sentences remain point estimates rather than actual head counts. In addition, the prison, probation, parole, and jail populations we report for 2022 are also estimated, based on year-end 2020 (or 2018 for jail populations) data and the recent state-specific trends in each state. In other work, we have presented figures that adjust or “bound” these estimates by assuming different levels of recidivism, inter-state mobility, and state-specific variation. With these caveats in mind, the results reported here present our best account of the prevalence of U.S. disenfranchisement in 2022. These estimates will be adjusted if and when we discover errors or omissions in the data compiled from individual states, U.S. Census and Bureau of Justice Statistics sources, or in our own spreadsheets and estimation procedures. Importantly, our estimates only estimate the number of individuals legally disenfranchised based upon current state law and policies. Our estimates do not include aspects of “practical” or de facto disenfranchisement – wherein individuals legally allowed to vote do not do so due to legal ambiguity, misinformation regarding voting eligibility, fear of an illegal voting conviction, among other reasons related to criminal records and voting. In other words, the estimates here do not reflect any “chilling” effects that disenfranchisement laws and their enforcement may have.
| State | Prison | Parole | Felony probation | Jail | post-sentence | Total | Voting Eligible Population | % Disf. |
|---|---|---|---|---|---|---|---|---|
| Alabama | 25,328 | 8,245 | 29,392 | 1,518 | 254,197 | 318,681 | 3,709,180 | 8.59 |
| Alaska | 3,301 | 1,003 | 2,249 | 6,552 | 532,553 | 1.23 | ||
| Arizona | 37,731 | 6,887 | 53,666 | 1,300 | 157,052 | 256,636 | 5,049,926 | 5.08 |
| Arkansas | 16,094 | 25,852 | 38,914 | 798 | 81,658 | 2,219,479 | 3.68 | |
| California | 97,328 | 97,328 | 25,774,911 | 0.38 | ||||
| Colorado | 16,168 | 1,287 | 17,455 | 4,153,976 | 0.42 | |||
| Connecticut | 6,892 | 6,892 | 2,615,815 | 0.26 | ||||
| Delaware | 3,396 | 373 | 2,592 | 1,360 | 7,721 | 723,159 | 1.07 | |
| Florida | 81,027 | 4,280 | 125,625 | 5,484 | 934,529 | 1,150,944 | 15,296,734 | 7.52 |
| Georgia | 47,141 | 19,447 | 163,475 | 4,347 | 234,410 | 7,482,329 | 3.13 | |
| Hawaii | 3,007 | 3,007 | 1,020,517 | 0.29 | ||||
| Idaho | 8,171 | 5,967 | 12,935 | 412 | 27,485 | 1,255,411 | 2.19 | |
| Illinois | 29,729 | 1,702 | 31,431 | 9,064,396 | 0.35 | |||
| Indiana | 23,944 | 1,857 | 25,801 | 4,933,505 | 0.52 | |||
| Iowa | 8,307 | 7,261 | 9,935 | 438 | 4,189 | 30,130 | 2,331,653 | 1.29 |
| Kansas | 8,779 | 5,428 | 4,108 | 711 | 19,026 | 2,097,052 | 0.91 | |
| Kentucky | 18,552 | 14,429 | 41,109 | 2,299 | 76,338 | 152,727 | 3,362,354 | 4.54 |
| Louisiana | 26,964 | 19,409 | 2,785 | 2,914 | 52,073 | 3,467,869 | 1.5 | |
| Maine | 0 | 1,070,612 | 0 | |||||
| Maryland | 15,623 | 964 | 16,587 | 4,313,168 | 0.38 | |||
| Massachusetts | 6,762 | 1,007 | 7,769 | 5,030,986 | 0.15 | |||
| Michigan | 33,617 | 1,664 | 35,281 | 7,528,995 | 0.47 | |||
| Minnesota | 8,148 | 7,359 | 38,992 | 693 | 55,192 | 4,113,452 | 1.34 | |
| Missouri | 23,062 | 20,729 | 37,773 | 1,218 | 82,782 | 4,630,115 | 1.79 | |
| Montana | 3,927 | 296 | 4,223 | 823,797 | 0.51 | |||
| Nebraska | 5,306 | 1,156 | 4,057 | 369 | 7,072 | 17,960 | 1,373,561 | 1.31 |
| Nevada | 11,422 | 766 | 12,188 | 2,071,272 | 0.59 | |||
| New Hampshire | 2,352 | 172 | 2,524 | 1,065,299 | 0.24 | |||
| New Jersey | 12,830 | 1,169 | 13,999 | 6,156,380 | 0.23 | |||
| New Mexico | 5,500 | 2,725 | 8,586 | 762 | 17,572 | 1,511,406 | 1.16 | |
| New York | 34,128 | 2,425 | 36,553 | 13,764,741 | 0.27 | |||
| North Carolina | 29,461 | 29,461 | 7,636,496 | 0.39 | ||||
| North Dakota | 1,401 | 151 | 1,552 | 564,942 | 0.27 | |||
| Ohio | 45,036 | 1,974 | 47,010 | 8,855,290 | 0.53 | |||
| Oklahoma | 22,462 | 2,237 | 15,332 | 1,181 | 41,212 | 2,855,801 | 1.44 | |
| Oregon | 12,753 | 549 | 13,302 | 3,108,030 | 0.43 | |||
| Pennsylvania | 39,357 | 3,619 | 42,976 | 9,778,957 | 0.44 | |||
| Rhode Island | 1,606 | 1,606 | 795,022 | 0.2 | ||||
| South Carolina | 16,157 | 4,638 | 17,923 | 1,164 | 39,882 | 3,849,680 | 1.04 | |
| South Dakota | 3,250 | 3,673 | 6,350 | 191 | 13,463 | 644,867 | 2.09 | |
| Tennessee | 22,685 | 12,407 | 56,403 | 2,940 | 377,157 | 471,592 | 5,082,240 | 9.28 |
| Texas | 135,906 | 110,437 | 201,830 | 6,986 | 455,160 | 18,578,831 | 2.45 | |
| Utah | 5,446 | 792 | 6,238 | 2,082,893 | 0.3 | |||
| Vermont | 0 | 497,391 | 0 | |||||
| Virginia | 31,838 | 2,017 | 64,280 | 3,061 | 211,344 | 312,540 | 6,198,540 | 5.04 |
| Washington | 15,724 | 1,277 | 17,001 | 5,344,645 | 0.32 | |||
| West Virginia | 6,044 | 3,682 | 3,959 | 530 | 14,215 | 1,428,525 | 1 | |
| Wisconsin | 20,298 | 23,174 | 20,589 | 1,334 | 65,394 | 4,392,490 | 1.49 | |
| Wyoming | 2,087 | 954 | 3,832 | 0 | 3,433 | 10,306 | 435,357 | 2.37 |
| Total | 1,036,047 | 313,769 | 966,691 | 62,321 | 2,026,671 | 4,405,497 | 230,674,600 | 2 |
| State | Prison | Parole | Felony probation | Jail | post-sentence | Total | Voting Eligible Population | % Disf. |
|---|---|---|---|---|---|---|---|---|
| Alabama | 13,519 | 4,916 | 9,775 | 715 | 114,631 | 143,557 | 974,304 | 14.73 |
| Alaska | 335 | 91 | 194 | 620 | 17,427 | 3.56 | ||
| Arizona | 5,614 | 832 | 6,273 | 192 | 15,363 | 28,274 | 226,015 | 12.51 |
| Arkansas | 6,721 | 9,554 | 11,141 | 287 | 27,703 | 332,943 | 8.32 | |
| California | 28,578 | 28,578 | 1,714,162 | 1.67 | ||||
| Colorado | 3,016 | 256 | 3,272 | 162,351 | 2.02 | |||
| Connecticut | 3,029 | 3,029 | 263,393 | 1.15 | ||||
| Delaware | 2,115 | 203 | 1,095 | 602 | 4,016 | 154,708 | 2.6 | |
| Florida | 38,665 | 2,287 | 31,087 | 1,994 | 217,778 | 291,811 | 2,282,871 | 12.78 |
| Georgia | 28,406 | 10,710 | 83,549 | 2,192 | 124,858 | 2,412,882 | 5.17 | |
| Hawaii | 134 | 134 | 21,353 | 0.63 | ||||
| Idaho | 267 | 179 | 130 | 13 | 590 | 7,012 | 8.41 | |
| Illinois | 15,866 | 833 | 16,699 | 1,327,451 | 1.26 | |||
| Indiana | 7,888 | 415 | 8,303 | 439,722 | 1.89 | |||
| Iowa | 2,129 | 1,375 | 1,738 | 89 | 979 | 6,310 | 66,241 | 9.53 |
| Kansas | 2,399 | 1,441 | 1,123 | 156 | 5,119 | 118,611 | 4.32 | |
| Kentucky | 4,052 | 2,902 | 7,094 | 475 | 15,010 | 29,533 | 257,551 | 11.47 |
| Louisiana | 18,143 | 11,630 | 1,393 | 1,698 | 32,865 | 1,092,970 | 3.01 | |
| Maine | 0 | 8,470 | 0 | |||||
| Maryland | 11,120 | 558 | 11,678 | 1,308,240 | 0.89 | |||
| Massachusetts | 1,934 | 222 | 2,156 | 324,711 | 0.66 | |||
| Michigan | 17,231 | 604 | 17,835 | 1,002,437 | 1.78 | |||
| Minnesota | 2,994 | 1,954 | 6,402 | 182 | 11,532 | 195,893 | 5.89 | |
| Missouri | 8,003 | 6,223 | 8,466 | 458 | 23,149 | 507,274 | 4.56 | |
| Montana | 103 | 11 | 114 | 3,925 | 2.89 | |||
| Nebraska | 1,454 | 257 | 518 | 88 | 1,061 | 3,377 | 56,884 | 5.94 |
| Nevada | 3,555 | 230 | 3,785 | 201,125 | 1.88 | |||
| New Hampshire | 159 | 15 | 174 | 12,921 | 1.35 | |||
| New Jersey | 7,772 | 509 | 8,281 | 841,838 | 0.98 | |||
| New Mexico | 398 | 161 | 402 | 43 | 1,004 | 31,082 | 3.23 | |
| New York | 17,066 | 1,049 | 18,115 | 2,092,184 | 0.87 | |||
| North Carolina | 15,148 | 15,148 | 1,666,061 | 0.91 | ||||
| North Dakota | 167 | 17 | 184 | 11,015 | 1.67 | |||
| Ohio | 19,454 | 738 | 20,192 | 1,035,777 | 1.95 | |||
| Oklahoma | 5,940 | 828 | 1,979 | 282 | 9,028 | 207,392 | 4.35 | |
| Oregon | 1,179 | 51 | 1,230 | 53,722 | 2.29 | |||
| Pennsylvania | 18,240 | 1,291 | 19,531 | 1,009,800 | 1.93 | |||
| Rhode Island | 477 | 477 | 44,021 | 1.08 | ||||
| South Carolina | 9,680 | 2,886 | 8,727 | 608 | 21,901 | 1,016,492 | 2.15 | |
| South Dakota | 266 | 212 | 520 | 16 | 1,014 | 7,902 | 12.83 | |
| Tennessee | 9,656 | 5,223 | 19,451 | 980 | 138,894 | 174,203 | 828,762 | 21.02 |
| Texas | 44,760 | 38,986 | 40,672 | 1,970 | 126,388 | 2,456,391 | 5.15 | |
| Utah | 400 | 50 | 450 | 20,519 | 2.19 | |||
| Vermont | 0 | 4,600 | 0 | |||||
| Virginia | 17,414 | 1,361 | 27,559 | 1,358 | 99,473 | 147,164 | 1,210,166 | 12.16 |
| Washington | 2,777 | 199 | 2,976 | 192,326 | 1.55 | |||
| West Virginia | 802 | 362 | 324 | 87 | 1,575 | 50,195 | 3.14 | |
| Wisconsin | 8,542 | 7,931 | 4,109 | 384 | 20,966 | 250,111 | 8.38 | |
| Wyoming | 89 | 43 | 86 | 0 | 69 | 287 | 3,798 | 7.56 |
| Total | 407,656 | 112,547 | 273,807 | 21,315 | 603,860 | 1,419,185 | 28,528,001 | 5 |
| State | Prison | Parole | Felony probation | Jail | post-sentence | Total | Voting Eligible Population | % Disf. |
|---|---|---|---|---|---|---|---|---|
| Alabama | 1,013 | 36 | 303 | 59 | 2,364 | 3,775 | 76,809 | 4.91 |
| Alaska | 89 | 37 | 79 | 205 | 31,283 | 0.65 | ||
| Arizona | 14,505 | 2,612 | 17,749 | 293 | 45,010 | 80,170 | 1,196,204 | 6.7 |
| Arkansas | 549 | 946 | 1,479 | 34 | 3,009 | 83,452 | 3.61 | |
| California | 43,435 | 43,435 | 7,861,159 | 0.55 | ||||
| Colorado | 4,994 | 274 | 5,268 | 664,369 | 0.79 | |||
| Connecticut | 1,919 | 1,919 | 320,257 | 0.6 | ||||
| Delaware | 200 | 10 | 150 | 64 | 423 | 40,241 | 1.05 | |
| Florida | 10,352 | 417 | 16,998 | 682 | 78,260 | 106,709 | 3,122,154 | 3.42 |
| Georgia | 1,895 | 1,128 | 4,146 | 297 | 7,467 | 377,649 | 1.98 | |
| Hawaii | 71 | 71 | 89,233 | 0.08 | ||||
| Idaho | 1,226 | 1,057 | 844 | 72 | 3,199 | 103,636 | 3.09 | |
| Illinois | 3,831 | 224 | 4,055 | 1,058,473 | 0.38 | |||
| Indiana | 1,014 | 87 | 1,101 | 206,166 | 0.53 | |||
| Iowa | 579 | 652 | 784 | 51 | 442 | 2,507 | 83,175 | 3.01 |
| Kansas | 1,080 | 611 | 505 | 88 | 2,285 | 150,451 | 1.52 | |
| Kentucky | 290 | 154 | 514 | 68 | 1,490 | 2,516 | 62,040 | 4.06 |
| Louisiana | 61 | 67 | 12 | 73 | 213 | 108,952 | 0.2 | |
| Maine | 0 | 14,296 | 0 | |||||
| Maryland | 694 | 77 | 771 | 241,276 | 0.32 | |||
| Massachusetts | 1,783 | 282 | 2,065 | 443,201 | 0.47 | |||
| Michigan | 596 | 60 | 656 | 264,865 | 0.25 | |||
| Minnesota | 460 | 533 | 2,201 | 87 | 3,281 | 125,905 | 2.61 | |
| Missouri | 480 | 418 | 647 | 55 | 1,600 | 127,555 | 1.25 | |
| Montana | 127 | 14 | 141 | 25,333 | 0.56 | |||
| Nebraska | 776 | 107 | 570 | 67 | 3,181 | 4,701 | 85,091 | 5.52 |
| Nevada | 2,477 | 122 | 2,599 | 408,068 | 0.64 | |||
| New Hampshire | 128 | 17 | 145 | 29,513 | 0.49 | |||
| New Jersey | 2,096 | 245 | 2,341 | 936,253 | 0.25 | |||
| New Mexico | 3,498 | 1,655 | 4,434 | 363 | 9,949 | 652,922 | 1.52 | |
| New York | 8,322 | 426 | 8,748 | 2,051,080 | 0.43 | |||
| North Carolina | 1,728 | 1,728 | 342,411 | 0.5 | ||||
| North Dakota | 87 | 8 | 95 | 16,362 | 0.58 | |||
| Ohio | 1,235 | 74 | 1,309 | 240,055 | 0.55 | |||
| Oklahoma | 1,717 | 266 | 870 | 113 | 2,966 | 171,357 | 1.73 | |
| Oregon | 1,696 | 71 | 1,767 | 248,587 | 0.71 | |||
| Pennsylvania | 3,651 | 378 | 4,029 | 529,558 | 0.76 | |||
| Rhode Island | 447 | 447 | 86,737 | 0.52 | ||||
| South Carolina | 120 | 50 | 278 | 47 | 495 | 112,668 | 0.44 | |
| South Dakota | 126 | 142 | 246 | 10 | 524 | 15,688 | 3.34 | |
| Tennessee | 556 | 383 | 1,713 | 59 | 7,820 | 10,531 | 128,753 | 8.18 |
| Texas | 44,766 | 32,899 | 78,890 | 2,457 | 159,011 | 5,671,638 | 2.8 | |
| Utah | 1,078 | 105 | 1,183 | 189,435 | 0.62 | |||
| Vermont | 0 | 8,127 | 0 | |||||
| Virginia | 984 | 12 | 1,209 | 118 | 4,226 | 6,550 | 353,218 | 1.85 |
| Washington | 2,420 | 127 | 2,547 | 411,344 | 0.62 | |||
| West Virginia | 42 | 11 | 30 | 7 | 90 | 17,049 | 0.53 | |
| Wisconsin | 1,823 | 2,087 | 1,081 | 93 | 5,083 | 180,969 | 2.81 | |
| Wyoming | 239 | 113 | 347 | 0 | 341 | 1,040 | 31,836 | 3.27 |
| Total | 171,255 | 46,403 | 136,079 | 7,784 | 143,198 | 504,719 | 29,796,853 | 2 |
*Tables 2-4 exclude data from Mississippi. The Sentencing Project retracts all Mississippi estimates regarding disenfranchisement by reason of criminal conviction, as these estimates were calculated assuming that all felonies in Mississippi are disenfranchising, when in fact, only a subset of felonies that appear on an enumerated list should be considered in this calculation. The actual size of Mississippi’s disenfranchised population is significantly smaller than we estimated; we will publish corrected estimates in our 2024 report. The Sentencing Project does not retract its conclusion that Black Mississippians continue to be disproportionately impacted by Mississippi’s disenfranchisement scheme. In a 2018 case that challenged Mississippi disenfranchisement law (Hopkins et al. v. Hosemann, No. 3:18-cv-188-CWR-LRA [S.D. Miss. 2018]), the plaintiffs’ expert witness, Dr. Dov Rothman estimated nearly 50,000 Mississippians were convicted of at least one disenfranchising offense from 1994 to 2017. However, these estimates do not take into account mortality or those who were disenfranchised prior to 1994 or outside of that period.
Acknowledgements
We thank Nick Dickens and Caleigh Lueder of the University of Minnesota, and Molly Hauf of Hamline University for their invaluable research assistance in compiling this report.
References
Antenangeli, Leonardo, and Matthew R. Durose. 2021. Recidivism of Prisoners Released in 24 States in 2008: A 10-Year Follow-Up Period (2008-2018). USDOJ.
Behrens, Angela, Christopher Uggen, and Jeff Manza. 2003. “Ballot Manipulation and the ‘Menace of Negro Domination’: Racial Threat and Felon Disenfranchisement in the United States, 1850-2002.” American Journal of Sociology 109:559-605.
Burch, Traci. 2012. “Did Disfranchisement Laws Help Elect President Bush? New Evidence on the Turnout Rates and Candidate Preferences of Florida’s Ex-felons.” Political Behavior 34: 1-26.
Chung, Jean. 2019. “Felony Disenfranchisement: A Primer.” Washington: The Sentencing Project.
Georgia Justice Project. 2022. “Voting with a Criminal Record in Georgia.” https://gjp.org/voting/
Grumbach, Jacob. 2022. Laboratories against Democracy: How National Parties Transformed State Politics. Princeton University Press.
Kang-Brown, Jacob. 2022. People in Prison in Winter 2021-22. Vera Institute of Justice. https://www.vera.org/downloads/publications/People_in_Prison_in_Winter_2021-22.pdf
Kang-Brown, Jacob, Chase Montagnet, and Jasmine Heiss. 2021. People in Jail and Prison in Spring 2021. Vera Institute of Justice. https://www.vera.org/downloads/publications/people-in-jail-and-prison-in-spring-2021.pdf
Klumpp, Tilman, Hugo M. Mialon, and Michael A. Williams. 2019. “The voting rights of ex-felons and election outcomes in the United States.” International Review of Law and Economics 59: 40-56.
Langan, Patrick and Mark Cunniff. 1992. “Recidivism of Felons on Probation, 1986-89.” NCJ 134177. Washington: Bureau of Justice Statistics.
Levine, Sam. 2022. The Black woman sentenced to six years in prison over a voting error.” The Guardian. February 3, 2022. https://www.theguardian.com/us-news/2022/feb/03/fight-to-vote-tennessee-pamela-moses-convicted.
Levitt, Justin. 2007. “The Truth About Voter Fraud.” New York, NY: Brennan Center for Justice.
Lopez, Ashley. 2022.”20 Were Charged for Voter Fraud in Florida. Advocates Say a Broken System is to Blame.” National Public Radio. August 27, 2022.
Manza, Jeff and Christopher Uggen. 2006. Locked Out: Felon Disenfranchisement and American Democracy. New York: Oxford University Press.
Manza, Jeff, Clem Brooks, and Christopher Uggen. 2004. “Public Attitudes toward Felon Disenfranchisement in the United States.” Public Opinion Quarterly 68:275-86.
McLeod, Morgan. 2018. “Expanding the Vote: Two Decades of Felony Disenfranchisement Reforms.” Washington: The Sentencing Project.
McNeil, Walter. 2010. “2009 Florida Prison Recidivism Study: Releases from 2001 to 2008.” Tallahassee, Florida: Florida Department of Corrections, Bureau of Research and Data Analysis.
Medina, Eduardo. 2022. “Black Woman’s Bid to Regain Voting Rights Ends With a 6-Year Prison Sentence.” New York Times. February 7, 2022. https://www.nytimes.com/2022/02/07/us/pamela-moses-sentence-tennessee.html.
Minnite, Lorraine. 2010. The Myth of Voter Fraud. Ithaca, NY: Cornell University Press.
Niesse, Mark. 2020. “Georgia Election Officials Say Ex-Felons Can Vote While Paying Debts.” Atlanta Journal-Constitution, September 17, 2020.
Office of Governor Ron DeSantis.2022. “Governor DeSantis Announces the Arrest of 20 Elections Criminals” (Press Release). August 18, 2022.
Porter, Nicole D. 2010. “Expanding the Vote: State Felony Disenfranchisement Reform, 2010.” The Sentencing Project, Washington DC.
Rozsa, Lori, and Tim Craig. 2022. “DeSantis’s New Election Crimes Unit Makes its First Arrests.” Washington Post. August 18, 2022.
Shannon, Sarah, Christopher Uggen, Jason Schnittker, Melissa Thompson, Sara Wakefield, and Michael Massoglia. 2017. “The Growth, Scope, and Spatial Distribution of People with Felony Records in the United States, 1948-2010.” Demography 54:1795-1818.
Uggen, Christopher, Jeff Manza, and Melissa Thompson. 2006. “Citizenship, Democracy, and the Civic Reintegration of Criminal Offenders.” Annals of the American Academy of Political and Social Science 605:281-310.
Uggen, Christopher and Jeff Manza. 2002. “Democratic Contraction? The Political Consequences of Felon Disenfranchisement in the United States.” American Sociological Review 67:777-803.
Uggen, Christopher, Ryan Larson, and Sarah Shannon. 2016. “6 Million Lost Voters: State-Level Estimates of Felony Disenfranchisement, 2016.” Washington: The Sentencing Project.
Uggen, Christopher, Sarah Shannon, and Jeff Manza. 2012. “State-level Estimates of Felon Disenfranchisement in the United States, 2010.” Washington: The Sentencing Project.
Uggen, Christopher, and Robert Stewart. 2022. “Disenfranchisement and Reenfranchisement of People Convicted of Felonies.” Paper presented at the Annual Meetings of the American Sociological Association (Presidential Panel on Voter Suppression, Institutions, and Displacement), August 8, 2022.
Wines, Michael. 2022. “In Voter Fraud, Penalties Often Depend on Who’s Voting. New York Times. September 7, 2022.
| 1. | The Voting Eligible Population is distinct from the Voting Age Population in that it excludes non-citizens. Our estimates for these populations are based on American Community Survey indicator B05003. |
|---|---|
| 2. | In Florida, some can avoid a formal felony conviction by successfully completing a period of probation. According to the Florida Department of Law Enforcement, as much as 40 percent of the total probation population holds this “adjudication withheld” status. According to reports by the Bureau of Justice Statistics, only about 50 percent of Florida probationers successfully complete probation. In light of this, we reduce the annual current disenfranchised felony probation numbers by 40 percent and individuals disenfranchised post-sentence by 20 percent (.4*.5=.20) in each year in the life tables. |
| 3. | Our data sources include numerous United States Department of Justice (USDOJ) publications, including annual series such as Probation and Parole in the United States, as well as the Prisoners and Jail Inmates at Midyear series. Where available, we used data from state departments of corrections rather than national sources, as in the case of Minnesota. For early years, we also referenced National Prisoner Statistics, and Race of Prisoners Admitted to State and Federal Institutions, 1926-1986. We determined the median age of released prisoners based on annual data from the National Corrections Reporting Program. The recidivism rate we use to decrease the releasee population each year is based upon Bureau of Justice Statistics (1989) “Recidivism of Prisoners Released in 1983 and a 10-year follow-up of prisoners released in 2008 (Antenangeli and Durose 2021) and “Recidivism of Felons on Probation 1986-1989.” For those in prison or on parole, we use a reincarceration rate of 18.6 percent at one year, 32.8 percent at two years, 41.4 percent at 3 years. Although rearrest rates have increased since 1983, the overall reconviction and reincarceration rates used for this study are much more stable (Langan and Levin (2002), p. 11). For those on probation or in jail, the corresponding three-year failure rate is 36 percent, |
| 4. | The current prison, parole, and probation counts come from the Bureau of Justice Statistics annual corrections reports. Jail data is obtained from the Vera Institutes Incarceration Trends dataset. Counts for current prison, parole, and felony probation (as well as prison and probation releases/entries |
| 5. | Five states have an integrated prison and jail system, and therefore do not disaggregate jail and prison populations in reporting to the Bureau of Justice Statistics. We adjusted |
| 6. | In Louisiana, people currently serving probation sentences and parole sentences who have not been incarcerated in prison during the previous 5 years are eligible to vote. We assume that 90 percent of people currently on parole and 10 percent of people currently serving felony-level probation sentences have been incarcerated in prison within the previous five years or convicted of a disqualifying offense, and are therefore disenfranchised. |
| 7. | Our statistics for Florida assume that 67 percent of the total Florida post-sentence population has outstanding legal financial obligations or other restrictions that would disqualify them from restoration of civil rights under current Florida law and administrative practices (see Florida Commission on Offender Review, Rules of Executive Clemency 2022). We also estimated the post-sentence disenfranchised population that assume both higher and lower rates of ineligibility due to monetary sanctions. Under the assumption that 50 percent of the population is currently voting-eligible, the post-prison disenfranchised population would be 643,000; under the assumption that only 25 percent of the population is currently voting-eligible, the post-prison disenfranchised population would be over 1,068,000. |
| 8. | Alabama reported 3,861 restorations in 2020 and 2021; the Arizona Board of Executive Clemency reported 0 pardons granted for fiscal years 2020, 2021, and 2022; Delaware reported 589 pardons and commutations for 2020, 2021, and through 6/16/22; Florida did not respond to our 2022 requests but in fiscal years 2020 and 2021 the Florida Commission on Offender Review reported 4,244 and 6,278 applications completed, respectively. Iowa reported 776 restorations of voting rights from 1/1/20 through 8/5/20, when post-sentence rights were restored by Executive Order 7; Kentucky reported 59 restorations among those who were not otherwise eligible for restoration under Executive Order 2019-033; Mississippi reported 100 restorations from 1/1/20 to 7/14/22; Nebraska reported 232 restorations from 1/1/20 to 7/29/22; Tennessee reported 2,034 restorations from 1/1/20 to 9/2/22; Virginia reported 84,801 restorations from 1/1/20 to 7/14/22; Wyoming reported 3 restorations from 1/1/20 to 7/7/22. |
| 9. | Flynn, Meagan. 2018. “Texas woman sentenced to 5 years in prison for voting while on probation.” Texas Tribune. March 30, 2018. |
| 10. | Crystal Mason v. State of Texas. Texas Court of Criminal Appeals. 2022. No. PD-0881-20. https://www.aclutx.org/sites/default/files/ccacrystalmason.pdf |
| 11. | State of Tennessee v. Pamela Moses. 2022. Criminal Court of Shelby County. No. 19-06482. https://www.documentcloud.org/documents/21200249-tennessee-vs-moses |
| 12. | Pamela Moses Certificate of Restoration of Voting Rights. 2019. https://www.documentcloud.org/documents/21273463-pamela-moses-certificate-of-restoration-redacted |
| 13. | Joe S. Williams Memorandum to Lisa Helton Re. Pamela Moses. 2019. https://www.documentcloud.org/documents/21272992-pamela-moses-email-redacted |
| 14. | State of Tennessee v. Pamela Moses. 2021. Criminal Court of Shelby County. No. 19-06482. https://www.documentcloud.org/documents/21676320-pamela-moses-trial |
meaning that individuals are in prison or jail and therefore counted in a different population. To extend the analysis to subsequent years, we calculated a trend line using the ratio of increases provided by Hoffman and Stone-Meierhoefer (1980) on federal prisoners. By year 10, we estimate a 59.4 percent recidivism rate among released prisoners and parolees, which increases to 65.9 percent by year 62 (the longest observation period in this analysis). Because these estimates are higher than most long-term recidivism studies, they are likely to yield conservative estimates of the formerly incarcerated population. We apply the same trend line to the 3-year
probation and jail recidivism rate of 36 percent; by year 62, the recidivism rate is 57.3 percent. 1948 is the earliest year for which detailed data are available on releases from supervision.
for the life tables) were available until year end 2020 (with the exception of the proportion felony probation which is only current in the BJS until 2016), and jail counts were available until year end 2018. Our previous reports extrapolated these numbers to the focal election year, but we assume greater stability in this year’s estimates due to the pandemic related instability of prison and jail populations from 2020-2022. We therefore do not carry forward the 2020 changes in corrections due to the COVD-19 pandemic into the future, which are captured in the BJS changes from 2019 to 2020. Current population counts were validated against preliminary
state and national prison reports from the Vera Institute for Winter 2021-22 (Kang-Brown 2022), jail reports for Spring 2021 (Kang-Brown et al. 2021), and 2022 counts from individual state departments of corrections.
the total reported prison populations in Alaska, Connecticut, Delaware, Hawaii, and Rhode Island downward by subtracting the estimated percentage of people who are serving non-felony sentences or awaiting trial (0.9*0.31=0.28). This effectively removes the estimated number who are incarcerated but not legally disenfranchised.

