Black Disparities in Youth Incarceration
Despite long-term declines in youth incarceration, Black youth remain vastly more likely to be incarcerated than their white peers. Black youth are almost six times as likely as their white peers to be held in juvenile facilities.
Related to: Youth Justice, Racial Justice
Incarceration disparities between Black and white youth have remained stubbornly high over the past decade. As of 2023, the most recent data, Black youth were 5.6 times as likely to be placed (i.e., detained or committed) in juvenile facilities as their white peers. The disparity is now at an all-time high, based on data that starts in 1997.1
Juvenile facilities held 29,314 youth as of October 2023. This includes placement in one of our nation’s 1,277 detention centers, residential treatment centers, group homes, and youth prisons.2 These numbers do not include the 437 people under age 18 in adult prisons at year-end 2022 or the estimated 2,000 people under 18 in adult jails at midyear 2023.3
- Nationally, the youth placement rate was 87 per 100,000 youth.
- Black youth were placed at a rate of 293 per 100,000, compared to the white youth rate of 52 per 100,000.
- 46% of youth in placement were Black, even though Black youth comprised only 15% of all youth across the United States.4
In all states with a population of at least 5,000 Black youth between ages 10 and 17, a cutoff that allows for meaningful comparisons, Black youth were at least 2.5 as likely to be in custody than white youth.
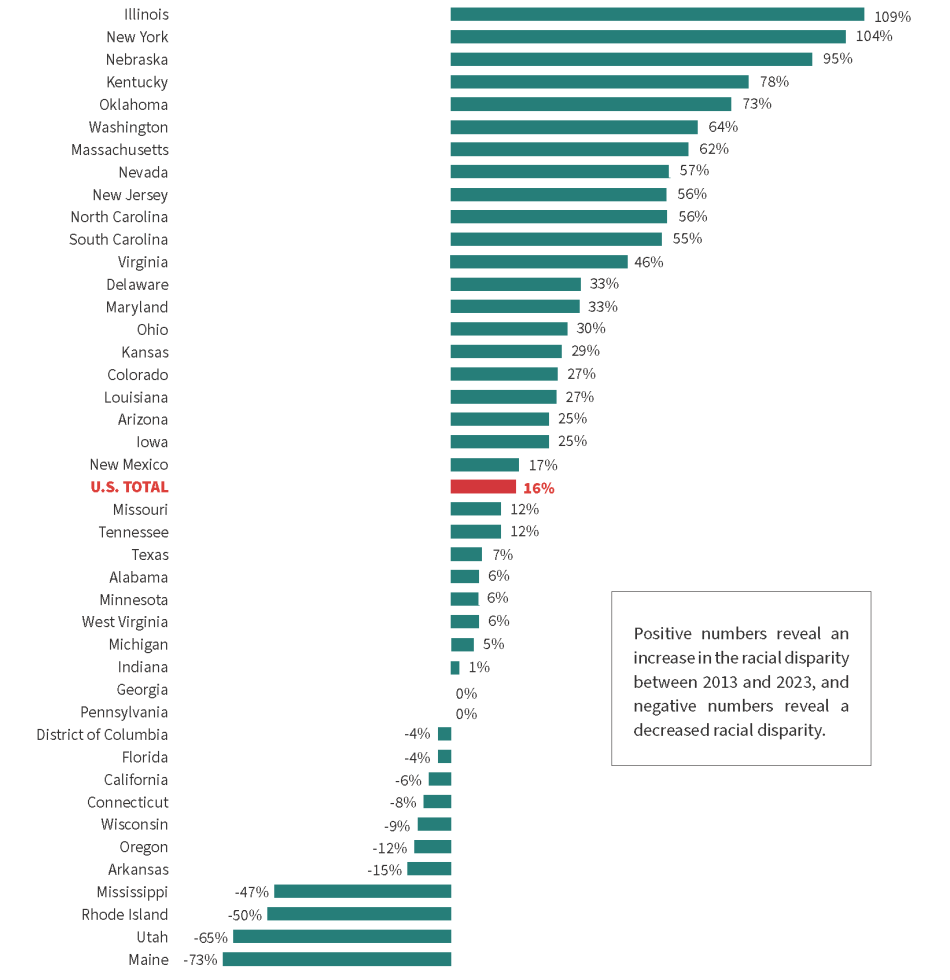
Over the last 10 years for which there are data, juvenile placements fell 46%. During this same period, Black-white racial disparities in youth incarceration grew more than 10% in 23 states and decreased by at least 10% in six states. Other trends during this period include:
- Illinois and New York saw their racial disparity at least double.
- Maine, Utah, and Rhode Island decreased their racial disparity by at least half.
Black youth were at least 10 times as likely to be held in placement as white youth in New Jersey, Connecticut, Nebraska, Wisconsin, Massachusetts, Utah, Illinois, New York, Oklahoma, Colorado, and Delaware.
| State | Black Rate | White Rate | B/W Disparity |
|---|---|---|---|
| Alabama | 299 | 87 | 3.4 |
| Arizona | 192 | 42 | 4.6 |
| Arkansas | 448 | 95 | 4.7 |
| California | 275 | 33 | 8.3 |
| Colorado | 504 | 47 | 10.7 |
| Connecticut | 86 | 5 | 17.2 |
| Delaware | 351 | 33 | 10.6 |
| District of Columbia | 407 | 94 | 4.3 |
| Florida | 254 | 72 | 3.5 |
| Georgia | 175 | 36 | 4.9 |
| Illinois | 231 | 18 | 12.8 |
| Indiana | 338 | 90 | 3.8 |
| Iowa | 482 | 49 | 9.8 |
| Kansas | 555 | 56 | 9.9 |
| Kentucky | 484 | 60 | 8.1 |
| Louisiana | 358 | 51 | 7.0 |
| Maine | 78 | 29 | 2.7 |
| Maryland | 104 | 12 | 8.7 |
| Massachusetts | 215 | 15 | 14.3 |
| Michigan | 269 | 40 | 6.7 |
| Minnesota | 312 | 32 | 9.8 |
| Mississippi | 120 | 36 | 3.3 |
| Missouri | 365 | 75 | 4.9 |
| Nebraska | 1,029 | 60 | 17.2 |
| Nevada | 677 | 95 | 7.1 |
| New Jersey | 241 | 6 | 40.2 |
| New Mexico | 574 | 114 | 5.0 |
| New York | 266 | 21 | 12.7 |
| North Carolina | 165 | 18 | 9.2 |
| Ohio | 559 | 77 | 7.3 |
| Oklahoma | 378 | 30 | 12.6 |
| Oregon | 701 | 137 | 5.1 |
| Pennsylvania | 380 | 44 | 8.6 |
| Rhode Island | 451 | 73 | 6.2 |
| South Carolina | 213 | 54 | 3.9 |
| Tennessee | 138 | 21 | 6.6 |
| Texas | 293 | 63 | 4.7 |
| Utah | 435 | 33 | 13.2 |
| Virginia | 322 | 39 | 8.3 |
| Washington | 423 | 46 | 9.2 |
| West Virginia | 865 | 225 | 3.8 |
| Wisconsin | 507 | 31 | 16.4 |
| U.S. TOTAL | 292 | 52 | 5.6 |
The table above and the figure below are limited are limited to the 41 states and the District of Columbia with at least 5,000 Black residents between 10- and 17-years old. Numbers in the third column reveal the extent to which Black youth are incarcerated relative to white youth. For example, in Alabama, Black youth are 3.4 times as likely to be held in a juvenile facility as their white peers.
Change in Black/White Youth Placement Disparity: 2013 to 2023
| 1. | Puzzanchera, C., Sladky, T.J., and Kang, W. (2025). Easy access to the census of juveniles in residential placement. National Center for Juvenile Justice. |
|---|---|
| 2. | Puzzanchera, C., Hockenberry, S., Sladky, T.J., and Kang, W. (2024). Juvenile residential facility census databook. National Center for Juvenile Justice. |
| 3. | Carson, E.A., and Kluckow, R. Prisoners in 2022 – Statistical tables (Table 15). Bureau of Justice Statistics. Zeng, Z. (2025). Jail inmates in 2023 – Statistical tables (Table 4). Bureau of Justice Statistics. |
| 4. | Puzzanchera, C., Sladky, A. and Kang, W. (2025). Easy access to juvenile populations: 1990-2023. National Center for Juvenile Justice. |

