Incarcerated Women and Girls
Research on female incarceration is critical to understanding the full consequences of mass incarceration and to unraveling the policies and practices that lead to their criminalization. The female incarcerated population stands almost seven times higher than in 1980.
Related to: Gender Justice, Youth Justice, Incarceration

Over the past quarter century, there has been a profound change in the involvement of women within the criminal legal system. This is the result of more expansive law enforcement efforts, stiffer drug sentencing laws, and post-conviction barriers to reentry that uniquely affect women. The female incarcerated population stands almost seven times higher than in 1980. Over sixty percent (62%) of imprisoned women in state prisons have a child under the age of 18.1
Between 1980 and 2022, the number of incarcerated women increased by more than 585%, rising from a total of 26,326 in 1980 to 180,684 in 2022. While 2020 saw a substantial downsizing due to the COVID-19 pandemic, this trend reversed with an 18% increase in 2022.
Rise in Women’s Incarceration, 1980-2022
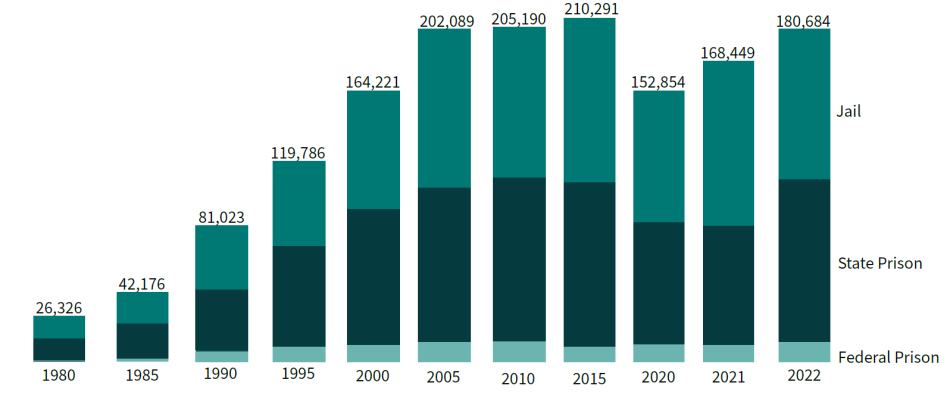
Sources: Historical Corrections Statistics in the United States 1850-1984 (1986); Prison and Jail Inmates at Midyear Series (1997- 2022), Prisoners Series (1980-2022). Bureau of Justice Statistics.
Though many more men are in prison than women, the rate of growth for female imprisonment has been twice as high as that of men since 1980. There are over 975,000 women under the supervision of the criminal justice system.
Women Under Control of the U.S. Corrections System, 2022
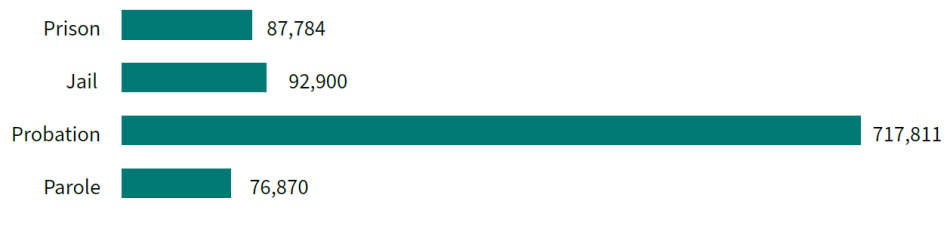
Sources: Carson, E. A., & Kluckow, R. (2023). Prisoners in 2022 – Statistical tables. Bureau of Justice Statistics.; Kaeble, D. (2024). Probation and parole in the United States, 2022. Bureau of Justice Statistics.; Zeng, Z. (2023). Jail inmates in 2022 – Statistical tables. Bureau of Justice Statistics.
Race and Ethnicity in Prisons
- In 2022, the imprisonment rate for Black women (64 per 100,000) was 1.6 times the rate of imprisonment for white women (40 per 100,000).
- Latina women were imprisoned at 1.2 times the rate of white women (49 vs. 40 per 100,000).
- The rate of imprisonment for Black and Latina women has declined since 2000, while the rate of imprisonment for white women has increased.
- Between 2000 and 2022, the rate of imprisonment in state and federal prisons declined by 69% for Black women, while the rate of imprisonment for white women rose by 18%.
Female Imprisonment Rate per 100,000, by Race and Ethnicity, 2000-2022
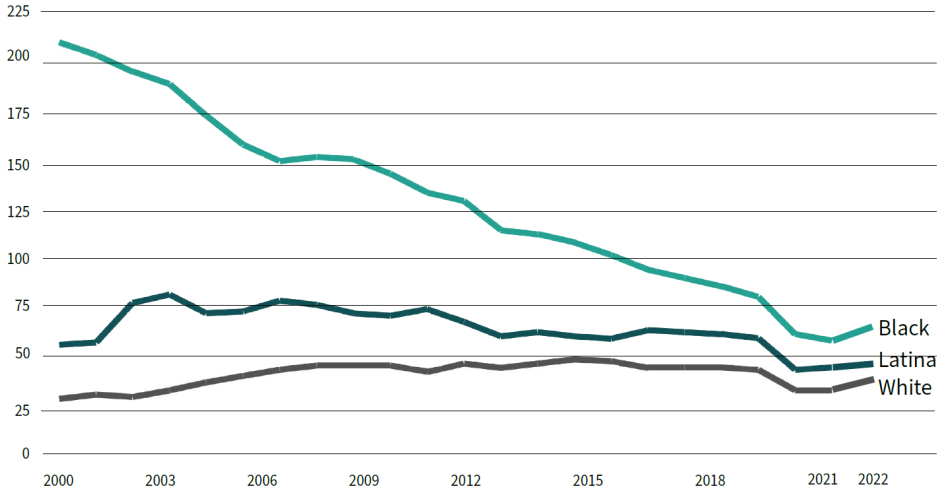
Source: Prisoners Series. Washington, DC: Bureau of Justice Statistics
| 2000 | 2022 | % Change | ||
|---|---|---|---|---|
| White | Women | 34 | 40 | 18% increase |
| Men | 449 | 337 | 25% decrease | |
| Black | Women | 205 | 64 | 69% decrease |
| Men | 3,547 | 1,826 | 47% decrease | |
| Latina | Women | 60 | 49 | 18% decrease |
| Latino | Men | 1,220 | 794 | 35% decrease |
Highest and Lowest Female State Imprisonment Rates (per 100,000 U.S. Female Residents), 2022
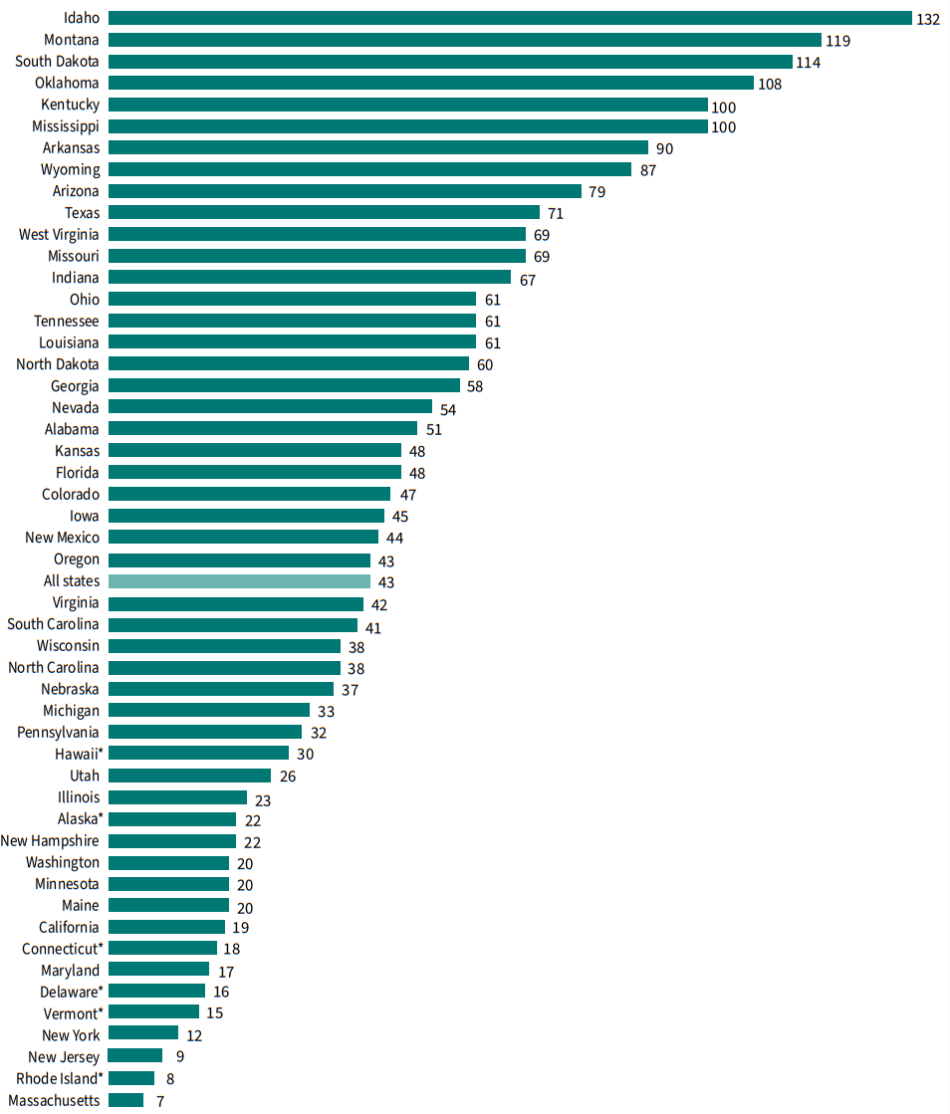
*In these states with integrated jail and prison systems, data include both jail and prison populations. Source: Carson, E. A., & Kluckow, R. (2023). Prisoners in 2022 – Statistical tables. Bureau of Justice Statistics.
State Variation
The rate at which women are incarcerated varies greatly from state to state. At the national level, including both state and federal imprisonment, 49 out of every 100,000 women were in prison in 2022. The state with the highest rate of female imprisonment is Idaho (132) and the state with the lowest incarceration rate of women is Massachusetts (7).
Offense Types for Men and Women in State Prisons
- Women in state prisons are more likely than men to be incarcerated for a drug or property offense. Twenty-five percent of women in prison have been convicted of a drug offense, compared to 12% of men in prison; 19% of incarcerated women have been convicted of a property crime, compared to 13% among incarcerated men.
- The proportion of imprisoned women convicted of a drug offense has increased from 12% in 1986 to 25% in 2021.
Offense Type by Gender in State Prisons, 2021
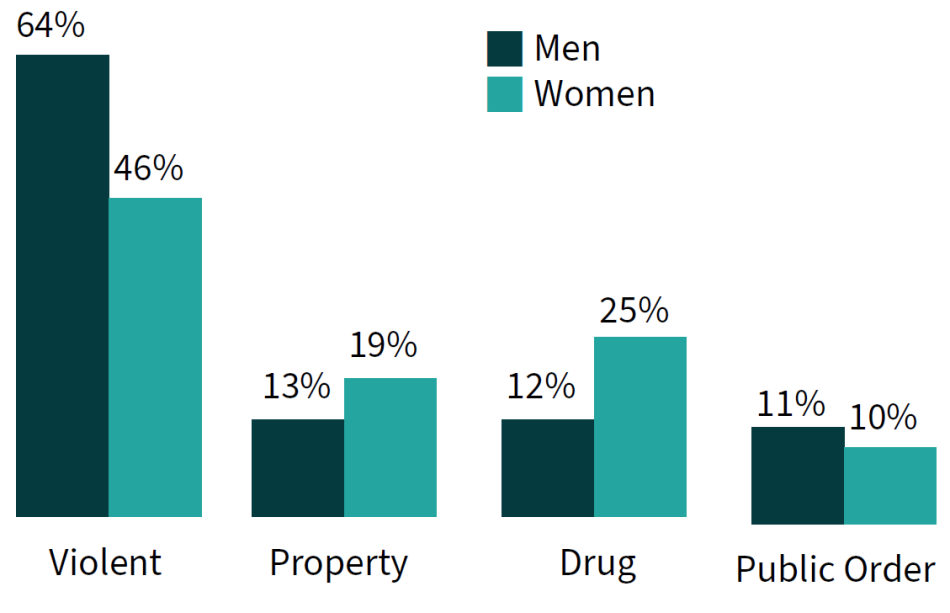
Source: Carson, E. A., & Kluckow, R. (2023). Prisoners in 2022 – Statistical tables. Bureau of Justice Statistics.
Incarcerated Girls
- Of the 24,894 youth in residential placement on a typical day, 14% (3,554) are girls.2
- As with boys, girls are confined considerably less frequently than at the start of the century. In 2001, 15,104 girls were confined in residential placement settings on a typical day. By 2021, this figure had been cut by over 75%.3
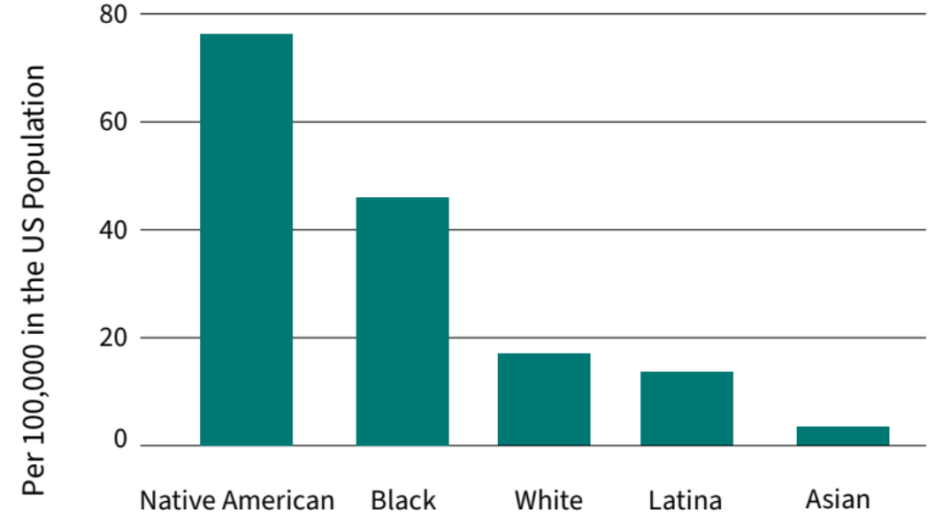
- The placement rate for all girls between ages 10 and 17 is 21 per 100,000 girls, yet Native American and Black girls are much more likely to be incarcerated than their peers. Native American girls have the highest incarceration rate, over 4 times the rate of white girls (76 per 100,000). Black girls are also disproportionately incarcerated at over 2.5 times the rate of white girls (46 per 100,000).4
- Though just 14% of youth incarcerated on a typical day are girls, they make up a much higher proportion of those incarcerated for the lowest level offenses. Thirty-seven percent of youth in placement for status offenses (such as truancy and curfew violations) are girls. Almost 60% of youth incarcerated for running away are girls. Overall, almost 25% of incarcerated girls are held for status offenses or for violating the terms of their probation.5
- In 2021, girls in the youth justice system were detained after their arrest 24,386 times and committed to out-of-home placement after their adjudication 5,259 times.6
Race of Incarceration for Girls by Race and Ethnicity, 2021
| State | Rate |
|---|---|
| Wyoming | 164 |
| West Virginia | 91 |
| Alaska | 85 |
| South Dakota | 56 |
| Alabama | 52 |
| State | Rate |
|---|---|
| Maine | 0 |
| Vermont | 0 |
| Hawaii | 5 |
| New Hampshire | 5 |
| Rhode Island | 6 |
Source: Puzzanchera, C., Sladky, T.J., and Kang, W. (2023). Easy access to the census of juveniles in residential placement. Office of Juvenile Justice and Delinquency Prevention.
Girls Comprise a Growing Proportion of All Teen Arrests, 1980-2020
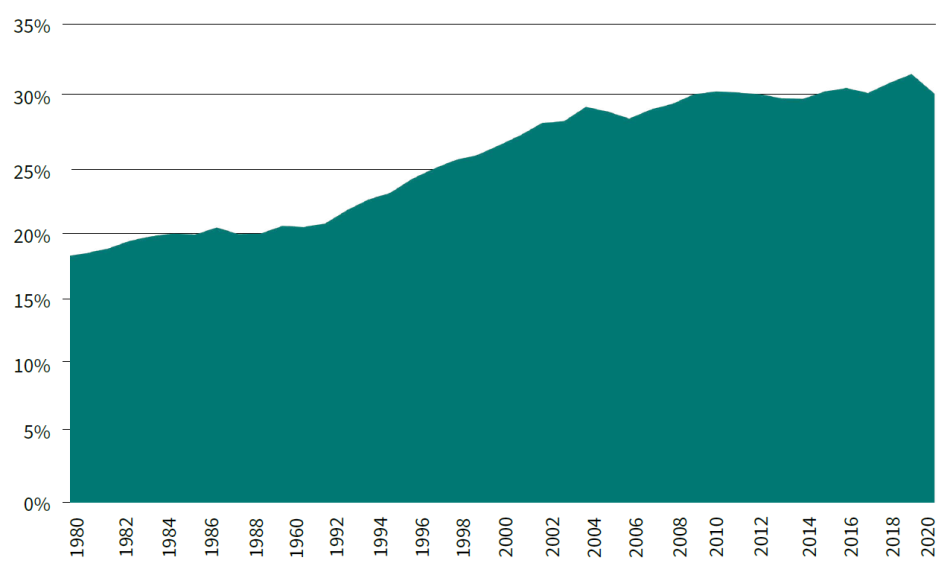
Source: OJJDP Statistical Briefing Book. Trends in the number of arrests by age group for all offenses.
In 1990, girls comprised 18% of all youth arrests, a proportion that grew to 29% in 2020.7
| 1. | Maruschak, L. M., Bronson, J., & Alper, M. (2021). Parents in prison and their minor children: Survey of prison inmates, 2016. Bureau of Justice Statistics. https://bjs.ojp.gov/library/publications/parents-prison-and-their-minor-childrensurvey-prison-inmates-2016 |
|---|---|
| 2. | Puzzanchera, C., Sladky, T.J., & Kang, W. (2023). Easy access to the census of juveniles in residential placement. Office of Juvenile Justice and Delinquency Prevention (OJJDP). https://www.ojjdp.gov/ojstatbb/ezacjrp/ |
| 3. | Puzzanchera et al. (2023), see note 2. |
| 4. | These calculations used two data sources: Puzzanchera et al. (2023), see note 2, and Puzzanchera, C., Sladky, A. & Kang, W. (2021). Easy access to juvenile populations: 1990-2020. OJJDP. https://www.ojjdp.gov/ojstatbb/ezapop/; The calculations of girls’ placement rates by race and ethnicity are based on the total US population for girls aged 10 to 17 and their corresponding residential placement counts. Other rate calculations among girls in this report are based on youth aged 10 through the upper age of juvenile court jurisdiction. This age is typically 17 years old, but not in every state. |
| 5. | Puzzanchera et al. (2023), see note 2. |
| 6. | Puzzanchera, C., Sladky, A., & Kang, W. (2023). Easy access to juvenile court statistics: 1985-2021. OJJDP. https://www.ojjdp.gov/ojstatbb/ezajcs/ |
| 7. | Statistical Briefing Book. (2022). Trend in percent of arrests by age group for all offenses. OJJDP. https://www.ojjdp.gov/ojstatbb/crime/ucr_trend.asp?table_in=1 |

