Private Prisons in the United States
Twenty-seven states and the federal government incarcerated 90,873 people in private prisons in 2022, representing 8% of the total state and federal prison population.
Related to: Incarceration, Sentencing Reform

Private for-profit prisons incarcerated 90,873 American residents in 2022, representing 8% of the total state and federal prison population. Since 2000, the number of people housed in private prisons has increased 5%.
Harmful crime policies of the 1980s and beyond fueled a rapid expansion in the nation’s prison population. The resulting burden on the public sector led to the modern emergence of for-profit prisons in many states and the federal system. Of the 1.2 million people in federal and state prisons, 8%, or 90,873 people, were in private prisons as of year end 2022.1
States show significant variation in the use of private prisons. At one end of the spectrum, Montana incarcerates almost half of its prison population in privately run facilities, but in another 23 states, private prisons are not used at all. A total of 27 states and the federal government use private corporations like GEO Group, Core Civic,2 LaSalle Corrections, and Management and Training Corporation to run some of their corrections facilities.
Montana is not alone in its heavy reliance on private prisons. Alaska, Arizona, Hawaii, New Mexico, and Tennessee rely considerably on private prisons for housing sentenced people. In these states, between 20% and 39% of the prison population resides in a for-profit prison (See Table 1).
| Jurisdiction | 2000 | 2021 | % Private 2021 | % Change 2000-2021 |
|---|---|---|---|---|
| Alabama | 0 | 253 | 1% | * |
| Alaska | 1,383 | 300 | 20% | -78% |
| Arizona | 1,430 | 9,738 | 29% | 581% |
| Arkansas | 1,540 | 0 | 0% | -100% |
| California | 4,547 | 0 | 0% | -100% |
| Colorado | 2,099 | 2,677 | 16% | 28% |
| Connecticut | 0 | 0 | 0% | * |
| Delaware | 0 | 0 | 0% | * |
| Florida | 3,912 | 11,728 | 14% | 200% |
| Georgia | 3,746 | 7,284 | 15% | 94% |
| Hawaii | 1,187 | 966 | 39% | -19% |
| Idaho | 1,162 | 861 | 10% | -26% |
| Illinois | 0 | 335 | 1% | * |
| Indiana | 991 | 3,906 | 16% | 294% |
| Iowa | 0 | 0 | 0% | * |
| Kansas | 0 | 0 | 0% | * |
| Kentucky | 1,268 | 814 | 4% | -36% |
| Louisiana | 3,068 | 0 | 0% | -100% |
| Maine | 11 | 0 | 0% | -100% |
| Maryland | 127 | 0 | 0% | -100% |
| Massachusetts | 0 | 0 | 0% | * |
| Michigan | 449 | 0 | 0% | -100% |
| Minnesota | 0 | 0 | 0% | * |
| Mississippi | 3,230 | 2,252 | 12% | -30% |
| Missouri | 0 | 0 | 0% | * |
| Montana | 986 | 2,319 | 49% | 135% |
| Nebraska | 0 | 0 | 0% | 0% |
| Nevada | 508 | 0 | 0% | -100% |
| New Hampshire | 0 | 0 | 0% | * |
| New Jersey | 2,498 | 834 | 7% | -67% |
| New Mexico | 2,155 | 1,522 | 31% | -29% |
| New York | 0 | 0 | 0% | * |
| North Carolina | 330 | 29 | 0% | -91% |
| North Dakota | 96 | 292 | 16% | 204% |
| Ohio | 1,918 | 6,540 | 14% | 241% |
| Oklahoma | 6,931 | 4,282 | 19% | -38% |
| Oregon | 0 | 0 | 0% | * |
| Pennsylvania | 0 | 447 | 1% | * |
| Rhode Island | 0 | 0 | 0% | * |
| South Carolina | 0 | 78 | 0% | * |
| South Dakota | 45 | 45 | 1% | 0% |
| Tennessee | 3,510 | 6,828 | 29% | 95% |
| Texas | 13,985 | 11,030 | 8% | -21% |
| Utah | 208 | 0 | 0% | -100% |
| Vermont | 0 | 110 | 14% | * |
| Virginia | 1,571 | 1,278 | 5% | -19% |
| Washington | 0 | 0 | 0% | * |
| West Virginia | 0 | 0 | 0% | * |
| Wisconsin** | 4,337 | 0 | 0% | -100% |
| Wyoming | 275 | 291 | 14% | -6% |
| Federal*** | 15,524 | 13,834 | 9% | -11% |
| Total | 85,027 | 90,873 | 8% | 5% |
* = Growth began at zero.
** = Wisconsin does not have anyone housed at private facilities. However, when a person
is housed out of state under the Interstate Corrections Compact or the Intergovernmental
Agreement, Wisconsin does not track if the facility is a private facility or state or federally owned facility.
*** = The Federal count includes Washington, DC residents convicted of a felony. As of December 31, 2001, DC residents convicted of a felony are the responsibility of the Federal Bureau of Prisons.
Source: Carson, E. A, & Kluckow, R. (2023). Prisoners in 2022 – Statistical Tables. Bureau of Justice Statistics. See Table 4 and Table 14.
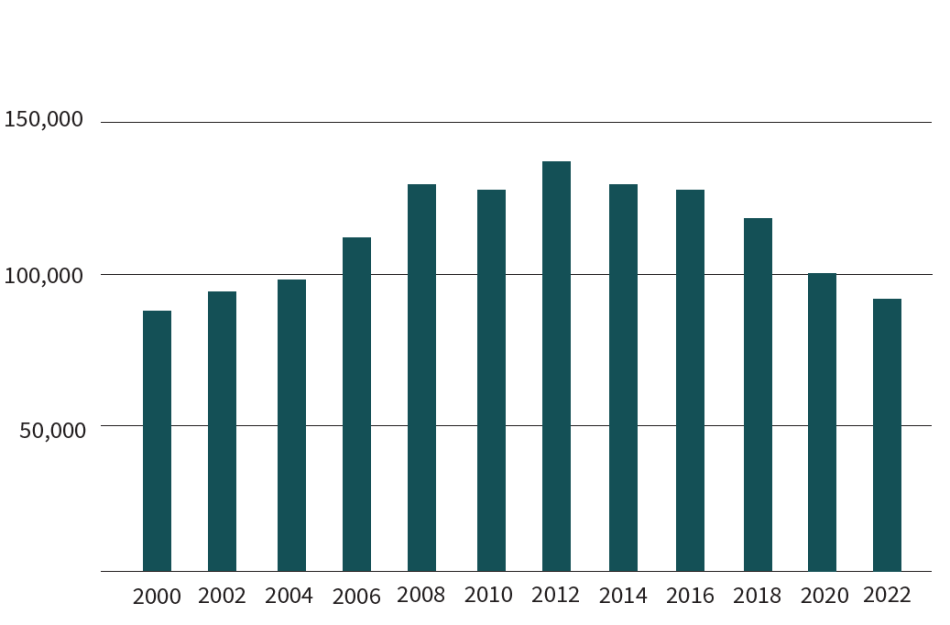
The proportion of imprisoned people in private facilities compared to public facilities has not changed considerably in the past 20 years. In 2000, 8% of the imprisoned population was also in private facilities; but fluctuations in the total number of people imprisoned over 20 years have translated to a 5% rise in the number of people serving their sentence in private prisons. Since 2012, however, the population in private prisons has decreased significantly.
FIGURE 1. Percent of Imprisoned People in Private Prisons, 2021
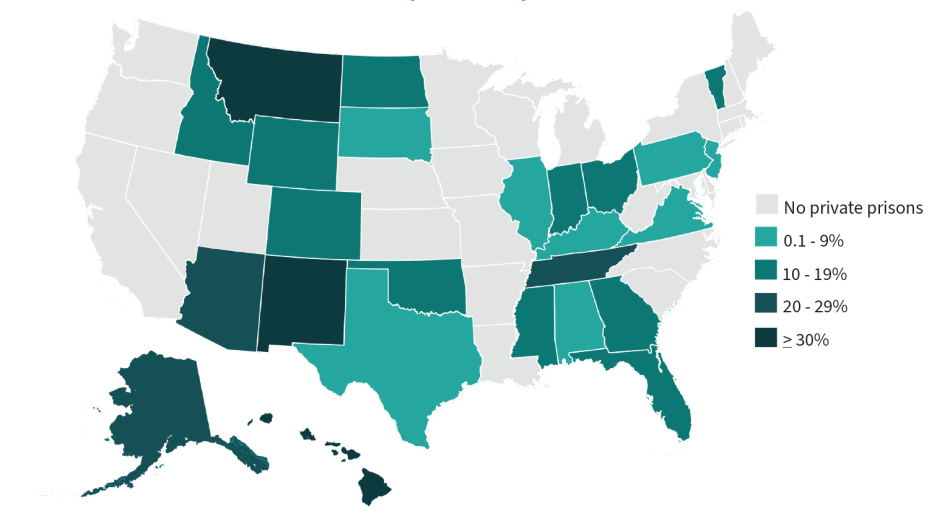
FIGURE 2. Number of People in Private Prisons, 2000-2022
Historically, the largest prison system relying on privatization has been the federal Bureau of Prisons (BOP). Since 2000, the BOP’s reliance on private facilities has decreased by 11%. The number of people in federal custody in its private facilities totaled 13,834 people in 2022.3 This decrease can be attributed to President Joseph Biden’s executive order to phase out the BOP’s use of private prison beds. A substantial number of people remain incarcerated, though, in these for-profit prisons.
Under the jurisdiction of the U.S. Department of Homeland Security, there is an average of 28,289 people held daily in immigrant detention, and it is estimated 79% of this population is held in privately run facilities.4
Political influences have been instrumental in securing the growth of for-profit private prisons. Because the prison population grew in 2022 for the first time in a decade, the privatization debate will likely intensify as opportunities for the prison industry may increase as corporations seek to make profits in related corrections areas.
| 1. | The counts presented in this fact sheet are primarily obtained from the Bureau of Justice Statistics’ Prisoners in 2022 – Statistical Tables report, with the exception of Connecticut, which provided its own figures |
|---|---|
| 2. | Formerly Corrections Corporation of America. |
| 3. | Federal private facilities include prisons, halfway houses, and systems of home confinement. |
| 4. | ACLU. (2021). More of the same: Private prison corporations and immigration detention under the Biden Administration.; U.S. Immigration and Customs Enforcement. (2021). FY 2023 detention statistics – ICE average daily population EOFY2023. https://www.ice.gov/doclib/detention/FY23_detentionStats.xlsx |