Mass Incarceration Trends
Report highlights the growth in state and federal prison populations since the early 1970s, and its far-reaching impact on individuals, families, communities, and society as a whole.
Related to: Sentencing Reform, Incarceration, Voting Rights, Youth Justice, Drug Policy, Federal Advocacy, Gender Justice, Racial Justice, Collateral Consequences
Mass incarceration remains a defining feature of the American criminal legal system. The United States ranks
among the highest worldwide in its dependence on incarceration.1 What began as a response to rising crime and the expansion of punitive drug policies evolved into a complex network of prisons, jails, probation, and parole that now supervises almost six million people.2 This system of control is vast, unevenly applied, and deeply consequential, with far-reaching social, economic, and political effects. People of color are acutely impacted. Nearly two million people, disproportionately Black, are living in prisons and jails instead of their communities. This contrasts sharply with the early 1970s, when this number was 360,000.3
In recent years, states have begun to experiment with sentencing reforms, alternatives to incarceration, and shifts in drug policy. Past federal reforms also reduced excessive and racially disparate sentences. Yet major challenges persist: long-term and life sentences continue to expand, and millions remain disenfranchised through felony voting restrictions. What’s more, many policymakers are seeking to roll back recent reforms that have scaled back mass incarceration and its racial injustice.
Mass Incarceration’s Reach
The social, moral, and fiscal costs associated with the large-scale, decades-long investment in mass imprisonment cannot be justified by any evidence of its effectiveness. Misguided changes in sentencing law and policy –not crime– account for the majority of the increase in correctional supervision.4
Mass incarceration instigates numerous poor physical, psychological, and economic outcomes for the people who experience imprisonment, for their families, as well as for the broader community.5 Imprisonment leads to declining prospects for employment and results in lower earnings in the longer term.6 Food insecurity, housing instability, and reliance on public assistance are also associated with prior imprisonment.7 Children of incarcerated parents suffer tremendously; imprisonment of a parent leads to significant declines in academic and health outcomes for children.8 High levels of incarceration also destabilizes entire communities, leading to dissolution of informal networks that are known to serve as barriers to neighborhood crime.9 Trust in law enforcement deteriorates as community members experience elevated levels of victimization and the loss of community members, friends, and family members to incarceration.10
The Surge in Prison Growth
In 1972, the imprisonment rate was 93 per 100,000 people.11 The prison expansion that commenced in 1973 reached its peak in 2009, achieving a seven-fold increase over the intervening years. Between 1985 and 1995 alone, the total prison population grew an average of eight percent annually. And between 1990 and 1995, all states, with the exception of Maine, substantially increased their prison populations, from 13% in South Carolina to as high as 130% in Texas. The federal system grew 53% larger during this five-year period alone.12
The number of people in prison began a marginal decline beginning in 201013 and continued along this course for more than a decade, including a remarkable 14% decline in 2020 alone, which was principally caused by reduced admissions during the first year of the COVID-19 pandemic. The year 2022 marked the first year in nearly a decade where the prison population rose again, by 2%. The prison population continued to rise by an additional 2% in 2023, led by increases in 39 states.
FIGURE 1. U.S. STATE AND FEDERAL PRISON POPULATION, 1925-2023
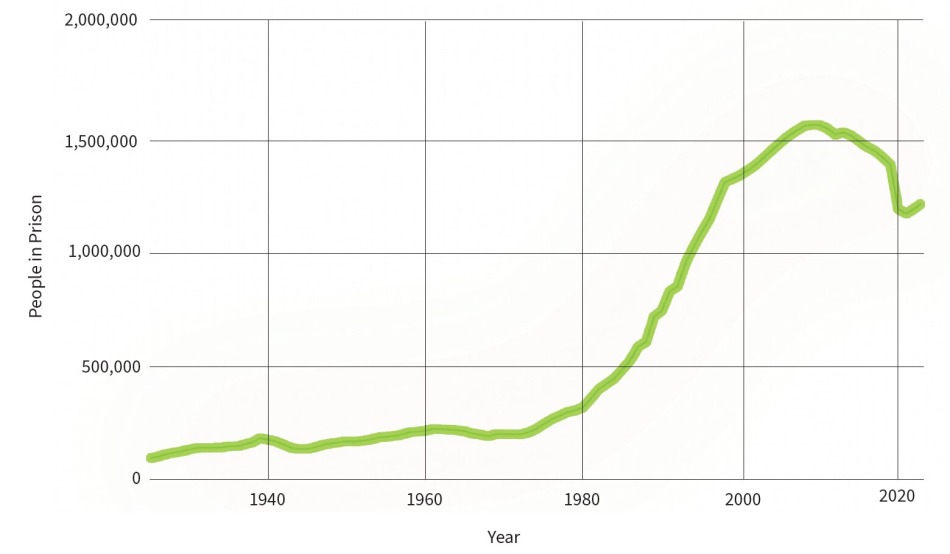
Sources: Cahalan, M. W. (1986). Historical corrections statistics in the United States, 1850-1984. Bureau of Justice Statistics; Mueller, D. and Kluckow, R. (2025). Prisoners in 2023 – Statistical tables. Bureau of Justice Statistics.
FIGURE 2. RANKED IMPRISONMENT RATES (PER 100,000 PEOPLE) IN STATE & FEDERAL PRISON, 2023
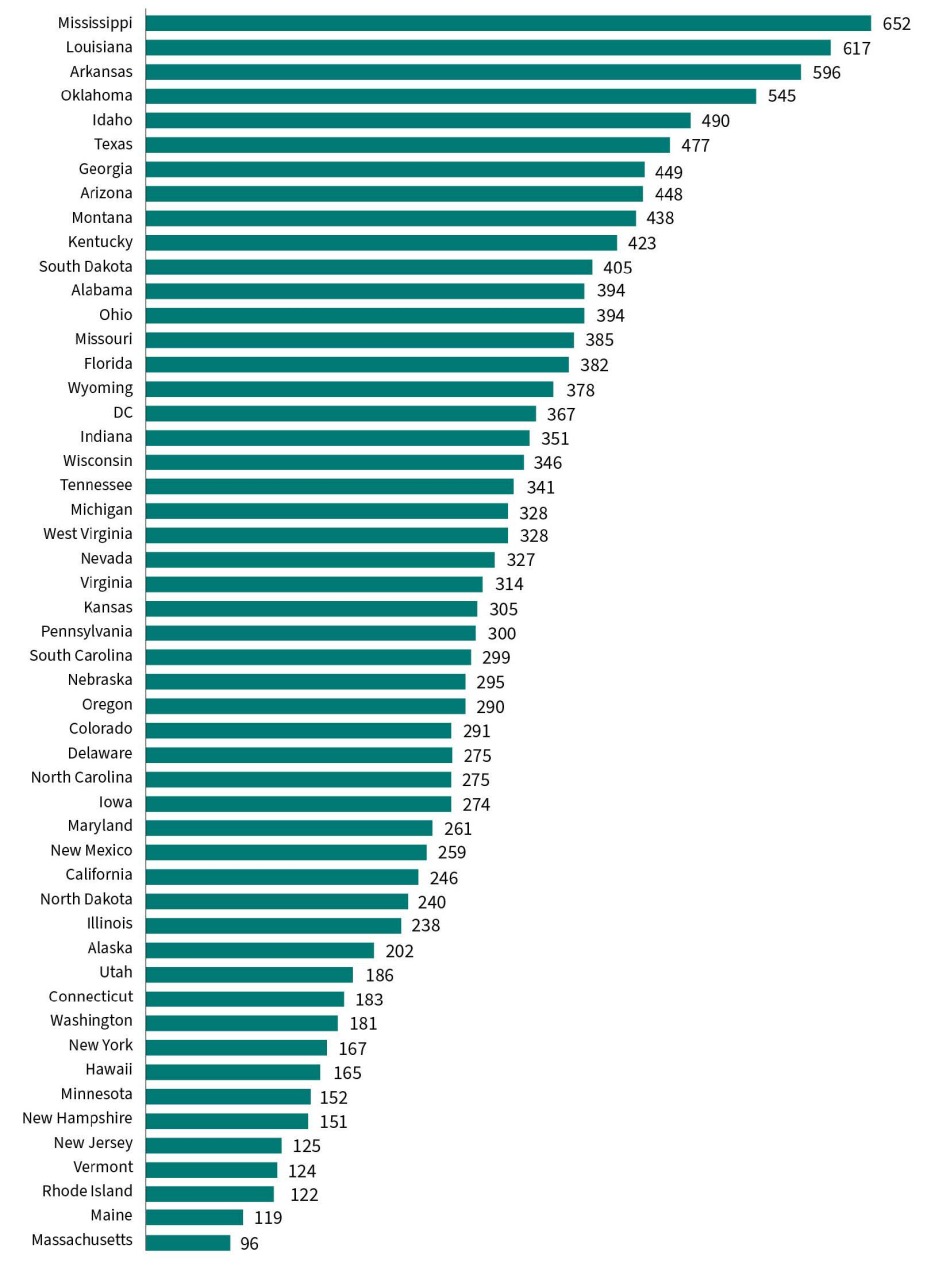
Source: Mueller, D. and Kluckow, R. (2025). Prisoners in 2023 – Statistical tables. Bureau of Justice Statistics; Corrections Information Council. (2023), Individuals incarcerated in the Bureau of Prisons under the DC Code as of October 1, 2023. People serving prison sentences for DC code violations are held in the federal Bureau of Prisons. Those serving a portion of their prison sentence in the DC Jail are not counted here.
In a global comparison, the United States remains a leader in per capita rates of incarceration. Though a handful of countries incarcerate a higher proportion of their population, the U.S. rate of incarceration is significantly higher than the rest of the world, including its closest neighbors, Canada and Mexico.
FIGURE 3. INTERNATIONAL RATES OF INCARCERATION
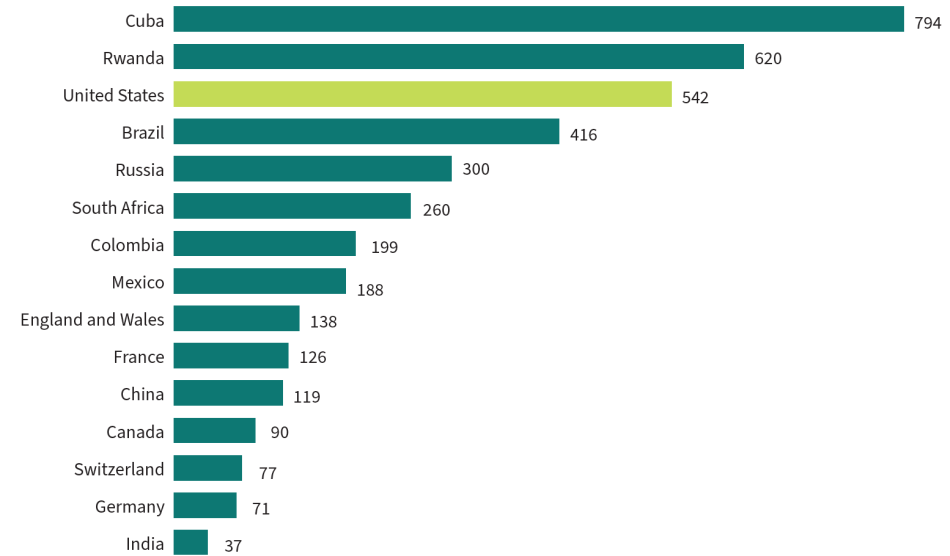
Source: World Prison Brief, compiled and hosted by the Institute of Crime and Justice Policy Research at Birkbeck, University of London. The graph above shows incarceration rates for 15 countries. The countries were selected to contextualize the U.S. rate and do not represent the 15 highest incarceration rates globally.
Offense Types
More than three in five people (62%) serving a state prison sentence have been convicted of a violent crime, as compared with 1970 when 30% of people in prison had been convicted of violence.14
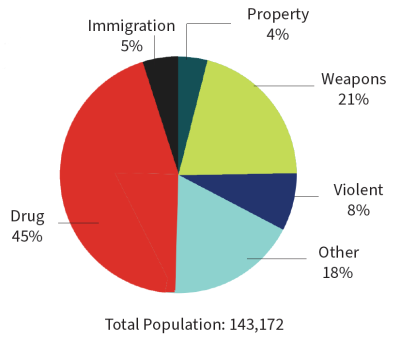
Offense types among those convicted in the federal and state prison systems are presented below (Figures 4 and 5). Despite common misconceptions that federal prison is reserved for the most violent crimes, it is the case that roughly half (45%) of those serving a federal prison sentence have been convicted of drug offenses.
FIGURE 4. STATE PRISON POPULATION BY OFFENSE, 2022
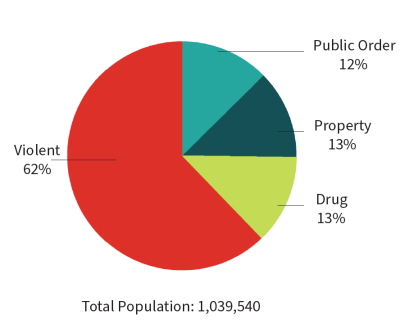
Source: Mueller, D. and Kluckow, R. (2025). Prisoners in 2023 – Statistical tables. Bureau of Justice Statistics.
FIGURE 5. FEDERAL PRISON POPULATION BY OFFENSE, 2023
 Source: Mueller, D. and Kluckow, R. (2025). Prisoners in 2023 – Statistical tables. Bureau of Justice Statistics.
Probation and Parole
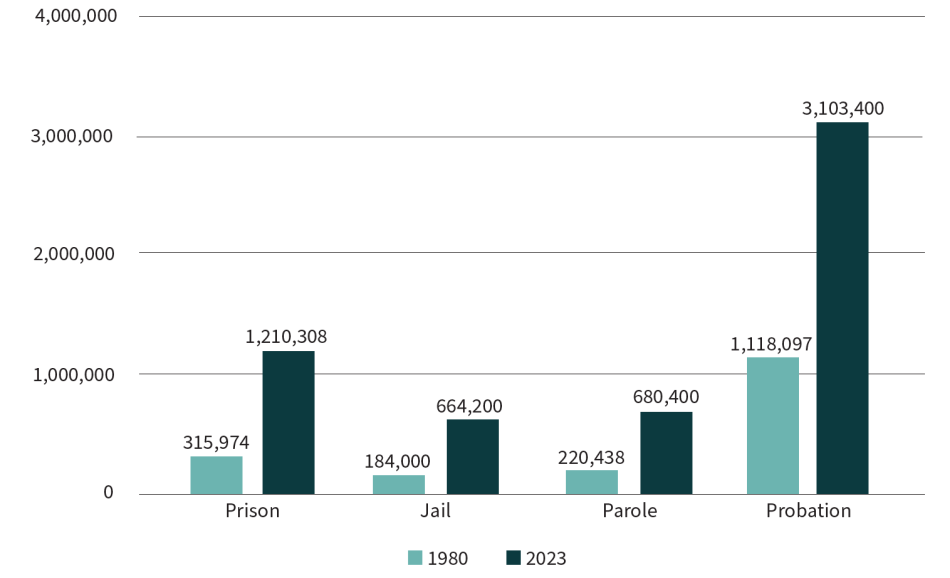
Probation and parole have expanded both in the absolute number and length of supervision for the past several decades.15 Between 1980 and 2023, the number of people on probation nearly tripled and the number of people under parole supervision more than tripled.
FIGURE 6. PEOPLE UNDER U.S. CORRECIONAL SUPERVISION, 1980 AND 2023
Sources: Cahalan, M. W. (1986). Historical corrections statistics in the United States, 1850-1984. Bureau of Justice Statistics, Table 7-9A; Gann, S. and Kaeble, D. (2025). Correctional populations in the United States, 2023 – Statistical tables. Bureau of Justice Statistics; Mueller, D. and Kluckow, R. (2025). Prisoners in 2023 – Statistical tables. Bureau of Justice Statistics.
Racial and Ethnic Disparities
One in five Black men born in 2001 is likely to be imprisoned at some point in their lifetime.16 People of color remain massively overrepresented in prisons, accounting for nearly 7 in 10 people in prison. Systemic causes range from a history of racial and ethnic subordination to ongoing police tactics that unfairly ensnare people of color into the system, and also include charging and sentencing practices that create stiffer punishments for people of color. Recent estimates find that one in 81 Black adults in the United States is serving time in state prison.17
Nearly one in five people in U.S. prisons—over 260,000 people—had already served at least 10 years as of 2019. This is an increase from 133,000 people in 2000—which represented 10% of the prison population in that year.18
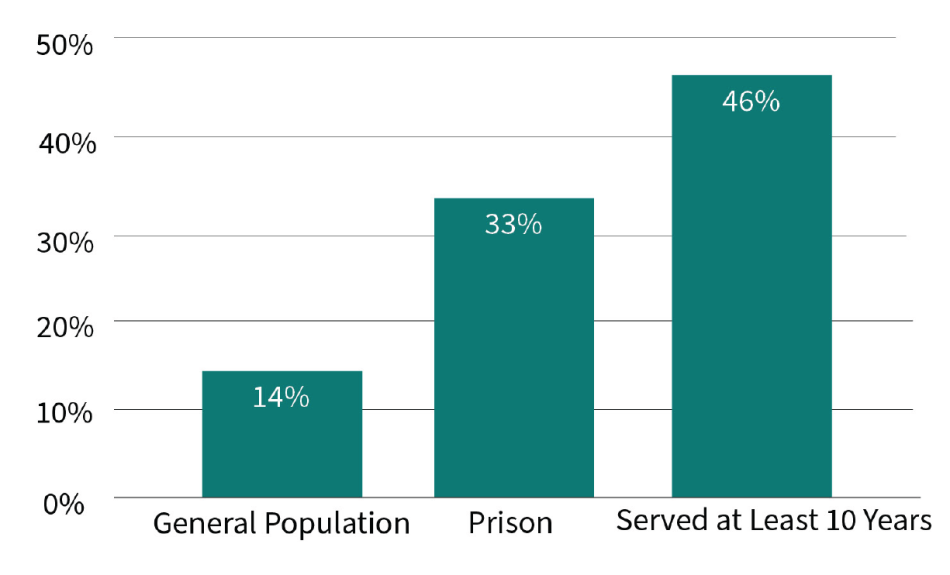
While Black Americans are vastly over-represented in the prison population, this disparity widens for those serving lengthy sentences. As depicted in Figure 8, in 2019, Black Americans represented 14% of the total U.S. population, 33% of the total prison population, and 46% of the prison population who had already served at least 10 years.19
FIGURE 7. RACIAL AND ETHNIC DISPARITIES IN STATE AND FEDERAL PRISONS, 2023
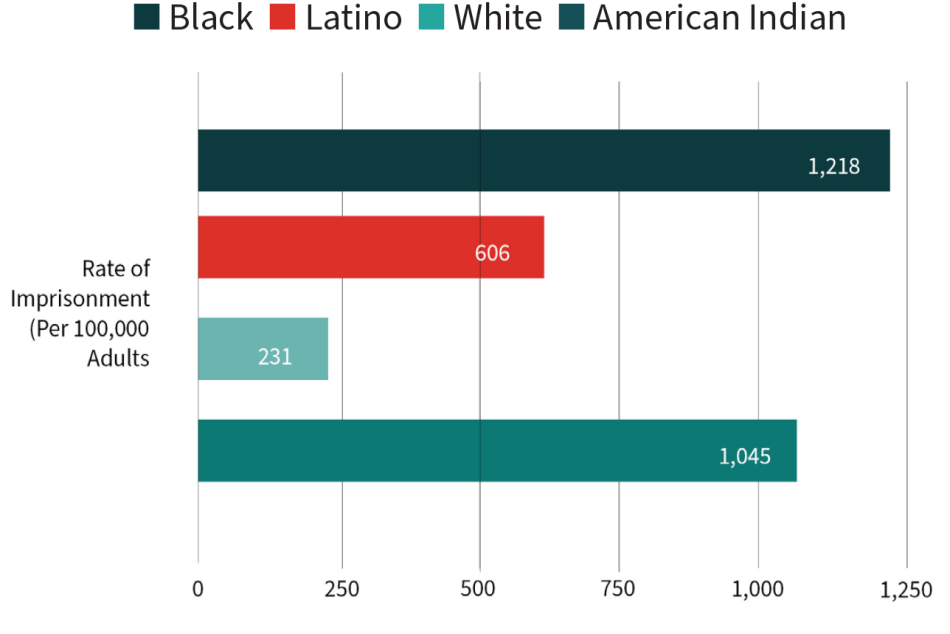
Source: Mueller, D. and Kluckow, R. (2025). Prisoners in 2023 – Statistical tables. Bureau of Justice Statistics.
FIGURE 8. BLACK AMERICANS AS A PERCENTAGE OF U.S. POPULATION, TOTAL PRISON POPULATION, AND PRISON POPULATION WHO HAVE SERVED AT LEAST 10 YEARS, 2019
Sources: U.S. Census Bureau, 2019 American Community Survey 1-Year Estimates; Carson, E.A. (2020). Prisoners in 2019. Bureau of Justice Statistics; Bureau of Justice Statistics. National Corrections Reporting Program, 1991-2019: Selected Variables. Inter-university Consortium for Political and Social Research [distributor], 2021-07-15.
Federal Drug Laws
Sentencing policies enacted under the banner of the “War on Drugs” which began in the early 1970s and accelerated with the utilization of broadly punitive mandatory minimum and three-strikes policies, resulted in dramatic growth in incarceration for drug offenses. This is particularly evident at the federal level, where 45% of the prison population is incarcerated for a drug offense.
The Sentencing Reform Act of 198420 established the United States Sentencing Commission (USSC) with the primary task of creating sentencing guidelines for the purpose of limiting the discretion of sentencing judges at the federal level.21 The guidelines went into effect in late 1987, at the same time that federal parole was eliminated, and federal prison sentences began their steep upward climb, especially for drug offenses.22 This climb was exacerbated by the passage of the Anti-Drug Abuse Act in 1986, which imposed stiff mandatory minimums for drug offenses, including a five-year mandatory minimum for the simple possession or sale of five grams of crack cocaine. In contrast, the mandatory minimum trigger for powder cocaine, a chemically identical drug to crack, required the sale of 100 times that amount. In 1986, people released after federal imprisonment for a drug conviction spent under two years in prison, but by 2005 people convicted of federal drug charges served an average of seven years.23 That increase was borne disproportionately by Black individuals: prior to the enactment of the Anti-Drug Abuse Act, the average federal drug sentence for Black individuals was 11% higher than for whites, four years after its passage, that figure increased to 49%.24
In 2010, the US Congress passed the Fair Sentencing Act in an effort to ameliorate some of the damage done by the law, reducing the sentencing cocaine disparity from 100-1 to 18-1.25 In 2019, the First Step Act applied the 2010 Fair Sentencing Act retroactively, and reduced other sentences for drug offenses. Approximately 4,000 people benefited from retroactivity of the law.26
In 2025, former President Joe Biden carried out one of the largest mass clemency initiatives in U.S. history, commuting the sentences of nearly 2,500 individuals convicted of non-violent drug offenses. The action brought relief to thousands who had received excessively harsh punishments under discredited distinctions between crack and powder cocaine – policies that disproportionately affected communities of color.27
FIGURE 9. PEOPLE IN FEDERAL PRISON FOR DRUG OFFENSES, 1980-2023
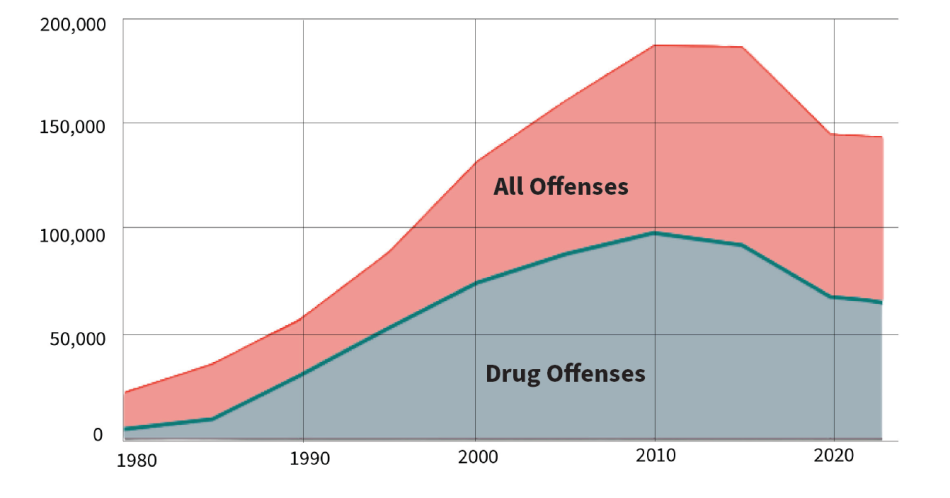
Sources: Bureau of Justice Statistics Prisoners Series; Albany University (n.d.) Sourcebook of criminal justice statistics online.
Women
At the start of the era of mass incarceration, fewer than 6,000 women were in state or federal prisons.28 This figure reached a high of 105,000–more than 17 times the 1970 level–by 2015, followed by marginal but steady declines since. Still, 2023’s population figures are far above those of the pre-mass incarceration era – more than 85,000 women were imprisoned in state or federal prison (see Figure 10). The growth in women’s imprisonment from 2022 to 2023 was more than double (4.1%) that of men (1.9%).
FIGURE 10. WOMEN IN STATE AND FEDERAL PRISONS
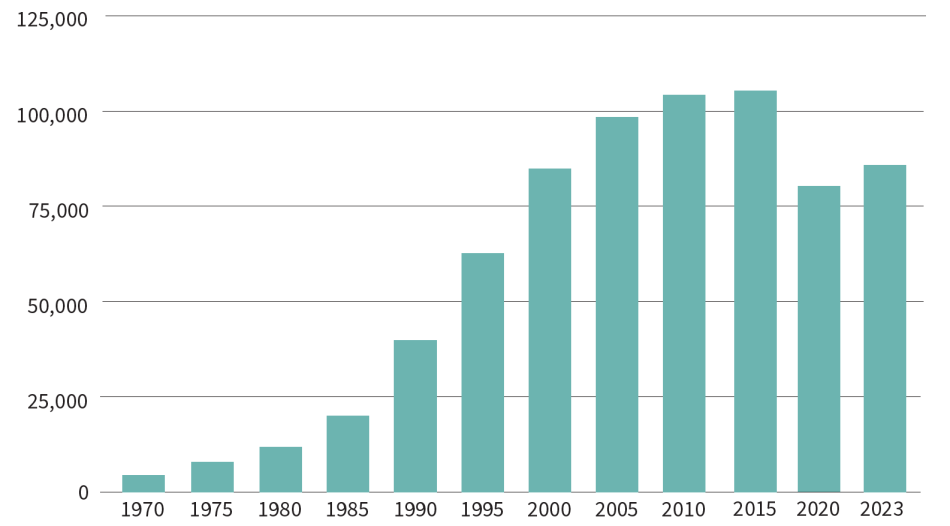
Source: Cahalan, M. W. (1986). Historical corrections statistics in the United States, 1850-1984. Bureau of Justice Statistics; BJS Prisoners Series (1985-2020).
Life and Long-Term Imprisonment
Mass incarceration’s toll on human dignity is no more apparent than in the staggering proliferation of life sentences; today one in six imprisoned people is serving a life sentence.29 Life sentences have consistently been included as a sentencing option, but their use expanded dramatically during the era of mass incarceration.30 Historically, life sentences came with the expectation of release; they were used to encourage good behavior among people who were incarcerated. Individuals were typically released in 10-15 years through parole or executive clemency.31
FIGURE 11. THE GROWTH OF LIFE SENTENCES, 1992-2024
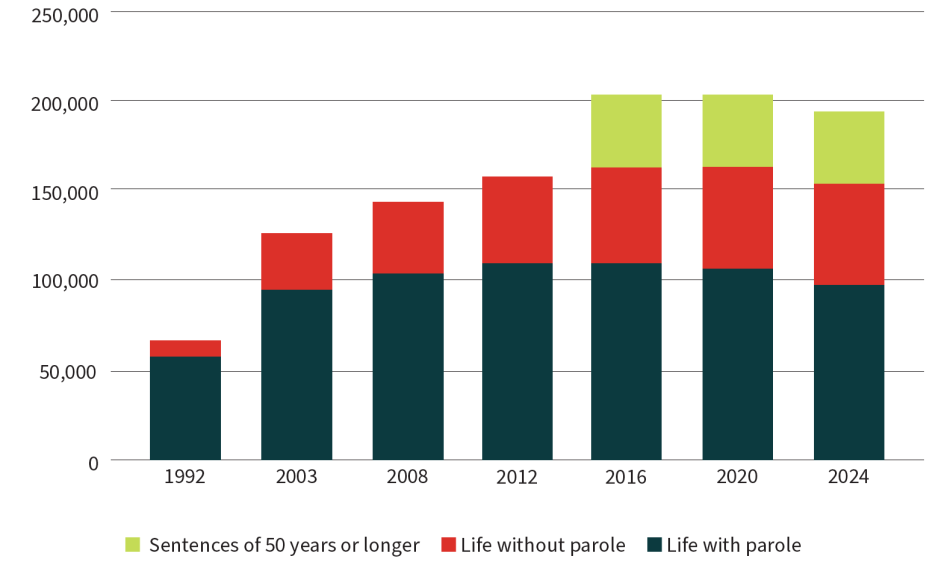
Sources: Figures for 1992 obtained from: Maguire, K., Pastore, A. L., & Flanagan, T. J. (Eds.) (1993). Sourcebook of Criminal Justice Statistics 1992. Bureau of Justice Statistics. Figures for 2005 obtained from: Liptak, A. (2005, October 5). Serving life with no chance at redemption. The New York Times. Data for 2003, 2008, 2012, 2016, 2020, and 2024 were collected from each state’s department of corrections by The Sentencing Project.
As depicted in Figure 11 above, in 1992, just over 9,000 people were reportedly serving life without parole (LWOP) and another 58,000 people were serving parole-eligible life sentences (LWP). By 2003, the number of people serving life without parole had more than tripled and parole-eligible lifers had increased 62%. By 2024, nearly six times as many people were serving LWOP, reaching an all-time high of 56,245; the total population of people serving LWP rose nearly 68% over these years.
Evidence shows that criminal careers are relatively short, in the range of 10 years,32 meaning that continued incarceration beyond this point produces diminishing returns on public safety, wasting limited resources that could be put toward effective crime prevention strategies. Long sentences also do little to deter criminal behavior because criminal engagement is often not rational and not carried out with a sophisticated understanding of the criminal code that determines punishment.33 Among youth and emerging adults, research finds that brain development impacts behavior.34 Sanctions that accommodate this reality incorporate reduced culpability for those who were young at the time of their offense.35
The growth of life imprisonment is echoed by the growth of long prison terms more broadly. Sentences of all lengths have expanded during the era of mass incarceration. The infamous “Rockefeller Drug Laws” (1973), which mandated 15 years for possession of marijuana and other drugs, was the first in a broad range of state-level mandatory sentencing schemes. In 1984, Washington state adopted the nation’s first “truth-in-sentencing” law that required people to serve 85% of their sentences, and 27 states quickly adopted similar laws over the next 15 years. Fourteen states had eliminated parole altogether.36
Racial disparities in the criminal legal system are at their most extreme among people serving life sentences; Black Americans comprise 55% of those serving life without the possibility of parole, the most extreme life sentence.37
Voting Rights
In 48 states, a felony conviction can result in an individual’s loss of voting rights. The period of disenfranchisement varies by state, with some states restoring the vote upon completion of a prison term, and others effectively disenfranchising for life. As a result of the dramatic expansion of the criminal legal system over the past 50 years, restrictions on voting rights for persons with a felony have diminished the political voice of many communities. As of 2024, an estimated 4 million Americans were unable to vote due to state laws restricting voting rights for those with felony convictions. Among voting-eligible African American adults, 4.5% are disenfranchised compared to 1.7% of the overall adult population. Seven out of ten people disenfranchised are living in communities, having fully completed their sentences or remain supervised while on felony probation or parole.38
| Race/Ethnicity | Rate |
|---|---|
| African American | 4.51% |
| Latino | 1.55% |
| White | 1.70% |
Source: Uggen, C., Larson R., Shannon, S., Stewart, R., & Hauff, M. (2024). Locked out 2024: Four million denied voting rights due to a felony conviction. The Sentencing Project.
Figure 12. Disenfranchisement Distribution Across Correctional Populations
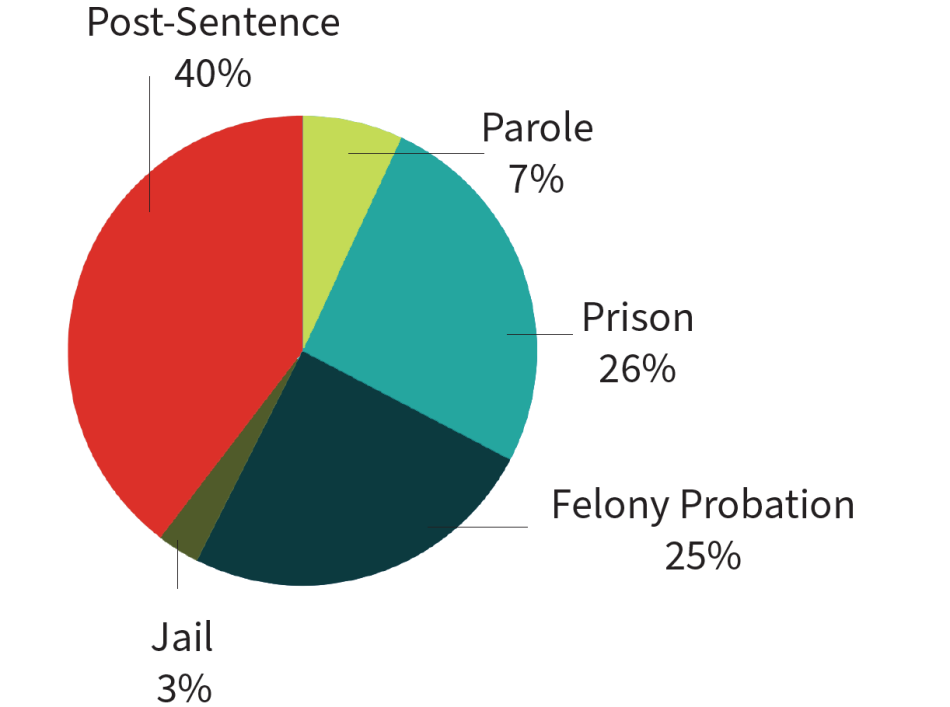
Source: Uggen, C., Larson R., Shannon, S., Stewart, R., & Hauff, M. (2024). Locked out 2024: Four million denied voting rights due to a felony conviction. The Sentencing Project.
Youth
Children and adolescents, especially youth of color, have also been swept up in mass incarceration’s harmful policies. Under the guise of concern over rising violent crime in the late 1980s and early 1990s, policymakers quickly adopted and spread the fabricated “superpredator” theory that described the rising generation of Black boys as especially dangerous.39 Proponents of the theory believed that age was irrelevant; certain offenses should be handled in adult criminal court, rather than juvenile court, regardless of the age and maturity of the person arrested. Lawmakers advanced policies that transferred tens of thousands of young people, some as young as 10 years old, into adult courts, jails, and prisons that, by design, do not account for age.40
With two decades of experience it is now abundantly clear that these policies were counterproductive. In particular, holding youth in facilities with adults is associated with heightened physical and sexual abuse as well as higher rates of recidivism upon release41
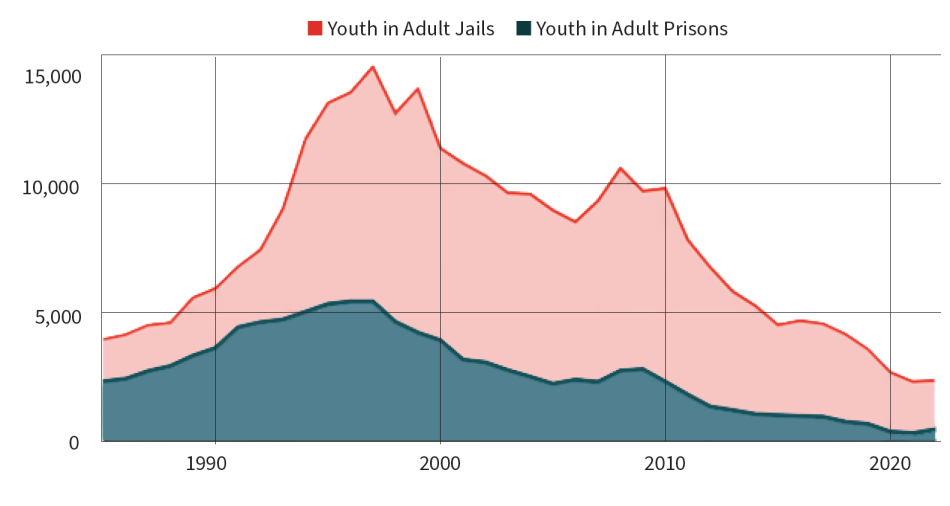
Youth incarceration started its decline sooner than adult incarceration. By the turn of the century, the number of youth in prisons and jails on a typical day was already declining, amounting to an 84% drop overall between 1997 and 2021.42 The year 2022 marked the first year in more than a decade that youth incarceration in adult prisons rose: in fact, the number of youth held in adult prisons on a single day jumped 50% between 2021 and 2022 and continued to increase in 2023. Though the number of youth in adult prisons rose sharply, the number of youth in adult jails on a single day has held roughly steady from 2021 to 2023.
FIGURE 13. YOUTH IN ADULT PRISONS AND JAILS, 1985-2023
Sources: Austin, J., Johnson, K. D., & Gregoriou, M. (2000). Juveniles in adult prisons and jails: A national assessment. Bureau of Justice Assistance; Bureau of Justice Statistics Prison and Jail Inmates at Midyear Series; Bureau of Justice Statistics Prisoner Series; Strom, K. J. (2000). Profile of state prisoners under age 18, 1985-1997. Bureau of Justice Statistics; Zeng, Z. (2023). Jail inmates in 2023 – Statistical tables. Bureau of Justice Statistics.
| 1. | Fair, H. & Walmsley, R. (2021). World prison population list, 13th edition. Institute for Crime and Justice Policy Research; Kluckow, R. & Zeng, Z. (2022). Correctional populations of the United States. Bureau of Justice Statistics. |
|---|---|
| 2. | Gann, S. & Kaeble, D. (2023). Correctional populations of the United States. Bureau of Justice Statistics. |
| 3. | American Correctional Association (1984). Corrections Compendium, 3(9); Bellin, J. (2022). Incarceration nation: How the United States became addicted to prisons and jails and how it can recover. Cambridge University Press. |
| 4. | National Research Council. (2014). The Growth of Incarceration in the United States: Exploring Causes and Consequences. J. Travis, B. Western, & S. Redburn, (Eds). The National Academies Press. |
| 5. | Johnson, R. C. & Raphael, S. (2009). The effects of male incarceration dynamics on acquired immune deficiency syndrome infection rates among African American women and men. Journal of Law and Economics 52(2), 251-293; Lee, H., Wildeman, C., Wang, E., Matusko, N., Jackson, J. (2014). A heavy burden: The cardiovascular health consequences of having a family member incarcerated. American Journal of Public Health 104; Massoglia, M., & Pridemore, W. A. (2015). Incarceration and health. Annual Review of Sociology, 41(1), 291–310. |
| 6. | Apel R. & Sweeten, G. (2010). The impact of incarceration on employment during the transition to adulthood. Social Problems 57(3), 448–79.; Pettit, B., & Western, B. (2004). Mass imprisonment and the life course: Race and class inequality in U.S. incarceration. American Sociological Review 69, 151–69. |
| 7. | Sugie, N. (2015). Chilling effects: Diminished political participation among partners of formerly incarcerated men. Social Problems, 62(4), 550-571; Harding, D., Morenoff, J., & Herbet, C.W. (2013). Home is hard to find: Neighborhoods, institutions, and the residential trajectories of returning prisoners. The Annals of the American Academy of Political and Social Science, 647(1), 214-236. |
| 8. | Geller, A., Cooper, C., Garfinkel, I., Schwartz-Soicher, O., Mincy, R. (2012). Beyond absenteeism: Father incarceration and child development. Demography, 49(1), 49–76; Wakefield S. & Wildeman, C. (2013). Children of the prison boom: Mass incarceration and the future of American inequality. Oxford University Press. |
| 9. | Clear, T. R. (2008). The effects of high imprisonment rates on communities. Crime and Justice 37(1), 97–132; Drakulich, K., Crutchfield, R., & Matsueda, R., & Rose, K. (2012). Instability, informal control, and criminogenic situations: Community effects of returning prisoners. Crime, Law and Social Change 57(5), 493-519. |
| 10. | Kirk, D. (2016). Prisoner reentry and the reproduction of legal cynicism. Social Problems, 63(2), 222-243. |
| 11. | Cahalan, M. W. (1986). Historical corrections statistics in the United States, 1850-1984. Bureau of Justice Statistics. |
| 12. | Gillard, D. K. & Beck, A. J. (1996). Prison and jail inmates, 1995. Bureau of Justice Statistics. |
| 13. | Guervino, P., Harrison, P.M., & Sabol, W. J. (2011). Prisoners in 2010. Bureau of Justice Statistics. |
| 14. | Cahalan, M. W. (1986). Historical corrections statistics in the United States, 1850-1984. Bureau of Justice Statistics, Table 3-17. Figures from 1970 show that 15.3% of persons were convicted of a “person offense” and an additional 14.4% were convicted of robbery which has since been categorized as a violent offense. Ten percent of imprisoned people were convicted of drug offenses in 1970 and 45% had been convicted of a property offense, including embezzlement, burglary, larceny, arson, and property theft. |
| 15. | Phelps, M. (2020). Mass Probation from Micro to Macro: Tracing the Expansion and Consequences of Community Supervision. Annual Review of Criminology, 3, 261-279. doi.org/10.1146/annurev-criminol-011419- 041352. |
| 16. | Robey, J., Massoglia, M., & Light, M. (2023). A generational shift: Race and the declining lifetime risk of imprisonment. Demography, https://doi.org/10.1215/00703370-10863378; see also Roehrkasse, A., & Wildeman, C. (2022). Lifetime risk of imprisonment in the United States remains high and starkly unequal. Scientific Advances, 8(48). https://www.science.org/doi/10.1126/sciadv.abo3395. For an in-depth discussion, see Ghandnoosh, N., Barry, C., & Trinka, L. (2023). One in Five: Racial Disparity in Imprisonment: Causes and Remedies. The Sentencing Project. |
| 17. | Nellis, A. (2021). The color of justice: Racial and ethnic disparities in state prisons. The Sentencing Project. |
| 18. | Ghandnoosh, N. & Nellis, A. (2022). How many people are spending over a decade in prison? The Sentencing Project. |
| 19. | Ghandnoosh, N. & Nellis, A. (2022). How many people are spending over a decade in prison? The Sentencing Project. |
| 20. | Chapter II of the Comprehensive Crime Control Act of 1984, P.L. 98-473. Implementation of the Sentencing Reform Act began in 1987. |
| 21. | These guidelines were originally mandatory, but were later converted to advisory by the U.S. Supreme Court in US v. Booker in 2005. United States v. Booker, 543 U.S. 220 (2005). |
| 22. | McDonald, D. C. & Carlson, K. E. (1992). Federal sentencing in transition. Bureau of Justice Statistics. McDonald, D. C. & Carlson, K. E. (1992). Federal sentencing in transition. Bureau of Justice Statistics. |
| 23. | Motivans, M. (2011). Federal Justice Statistics, 2009. Bureau of Justice Statistics.Table 11. |
| 24. | Vagins, D. & McCurdy, J. (2006). Cracks in the system: Twenty years of the unjust federal crack cocaine law. American Civil Liberties Union. |
| 25. | Fair Sentencing Act 21 USC § 801 (2010). https://www.congress.gov/bill/111th-congress/senate-bill/1789/text. |
| 26. | Garland, M. (2022, December 16). Additional department policies regarding charging, pleas, and sentencing in drug cases. Office of the Attorney General. https://www.justice.gov/media/1265321/dl?inline. |
| 27. | Gedeon, J. (2025, January 17). Joe Biden commutes sentences of nearly 2,500 non-violent drug offenders. The Guardian. |
| 28. | Historical Corrections Table 3-31. Shows that in 1970, just before the era of mass incarceration, 5,965 women were in prison and in 1980 (the next available year), 15,119 women were in prison. |
| 29. | Nellis, A. & Barry, C. (2025). A matter of life: The scope and impact of life and long term imprisonment in the United States. The Sentencing Project. |
| 30. | Seeds, C. (2022). Death by prison: the emergence of life without parole and perpetual confinement. University of California Press. |
| 31. | Gottschalk, M. (2015). Caught: The prison state and the lockdown of American politics. Princeton University Press; Mauer, M. & Nellis, A. The meaning of life: the case for abolishing life sentences. The New Press; Seeds, C. (2022). Death by prison: the emergence of life without parole and perpetual confinement. University of California Press. |
| 32. | Blumstein, A., & Piquero, A. (2007). Restore rationality to sentencing policy. Criminology & Public Policy, 6(4), 679-687; Kazemian, L. (2021). Pathways to desistance from crime among juveniles and adults: Applications to criminal justice policy and practice. National Institute of Justice; Kazemian, L., & Farrington, D. P. (2018). Advancing knowledge about residual criminal careers: A follow-up to age 56 from the Cambridge Study in Delinquent Development. Journal of Criminal Justice, 57, 1-10; Piquero, A., Hawkins, J., & Kazemian, L. (2012). Criminal career patterns. In R. Loeber & D. P. Farrington (Eds.), From juvenile delinquency to adult crime: Criminal careers, justice policy, and prevention (pp. 14–46). |
| 33. | Mauer, M. & Nellis, A. (2018). See note 29. |
| 34. | Cavanagh, C. (2022). Healthy adolescent development and the juvenile justice system: Challenges and solutions. Child Development Perspectives, 16, 141–147. |
| 35. | Bonnie, R. J., & Scott, E. S. (2013). The teenage brain: Adolescent brain research and the law. Current Directions in Psychological Science, 22(2), 158–161. https://doi.org/10.1177/0963721412471678 |
| 36. | Austin, J. & Eisen, L. B. (2016). How many Americans are unnecessarily incarcerated? The Brennan Center. |
| 37. | Nellis, A. & Barry, C. (2025). A matter of life: The scope and impact of life and long term imprisonment in the United States. The Sentencing Project. |
| 38. | Uggen, C., Larson R., Shannon, S., Stewart, R., & Hauff, M. (2024). Locked out 2024: Four million denied voting rights due to a felony conviction. The Sentencing Project. |
| 39. | DiIulio, J. (1995). The coming of the “Superpredator.” The Weekly Standard. |
| 40. | Nellis, A. (2015). A Return to justice: Rethinking Our Approach to Juveniles in the System. Rowman and Littlefield. |
| 41. | Lamibie, I. & Rambie, I. (2013).The impact of incarceration on juvenile offenders. Clinical Psychology Review, 33(3), 448-459. https://doi.org/10.1016/j.cpr.2013.01.007. |
| 42. | Mueller, D. and Kluckow, R. (2025). Prisoners in 2023 –Statistical tables. Bureau of Justice Statistics; Zeng, Z. (2023). Jail inmates in 2023 – Statistical tables. Bureau of Justice Statistics. |