America’s Incarceration Crossroads: Reversing Progress Amid Record-Low Crime Rates
Thirty-nine states increased prison populations in 2023, despite violent and property crime rates hitting historic lows
Related to: Incarceration
The U.S. criminal legal system stands at a crossroads. The United States remains a world leader in incarceration, locking up its citizens at a far higher rate than any other industrialized nation.1
Between 1972 and 2009, the number of people imprisoned grew nearly 700%,2 while crime rates declined dramatically after peaking in 1991.3 Imprisonment levels slowly scaled back, achieving a 25% decline between 2009 and 2021.4 Then, the prison population has resumed its growth, according to the most recently available data. The prison population grew in 2022 and in 2023, 39 states increased their prison populations.5
The COVID-19 pandemic contributed to a seismic increase in the most serious crime, homicide, which has fortunately declined to pre-pandemic levels. By 2024, homicide rates were 49% lower than their peak level in 1991. Violent and property crime rates overall have reached historic lows: 2024’s violent crime rate was 53% lower than its peak-1991 level and the property crime rate was 66% lower.6
While crime rates are at historic lows, Americans deserve greater levels of community safety. A growing number of elected officials at the local, state, and federal levels have moved to overturn successful criminal justice reforms and revert to the failed playbook of mass incarceration, while the federal government has cut funding for important crime-prevention programs.7 Instead, policymakers should respond to crime upticks with evidence-based responses, while correcting the counterproductive, costly, and cruel responses of the past.
Excessive reliance on imprisonment in the United States is ineffective at addressing crime, diverts resources from effective public safety investments, upends family stability, contributes to trauma, and disproportionately harms communities of color.8 A vast body of research has established that we can advance community safety while reducing prison admissions as well as scaling back sentences for both those entering prisons and those already there.9
Figure 1. Pace of Growth and Reduction in U.S. Prison Population
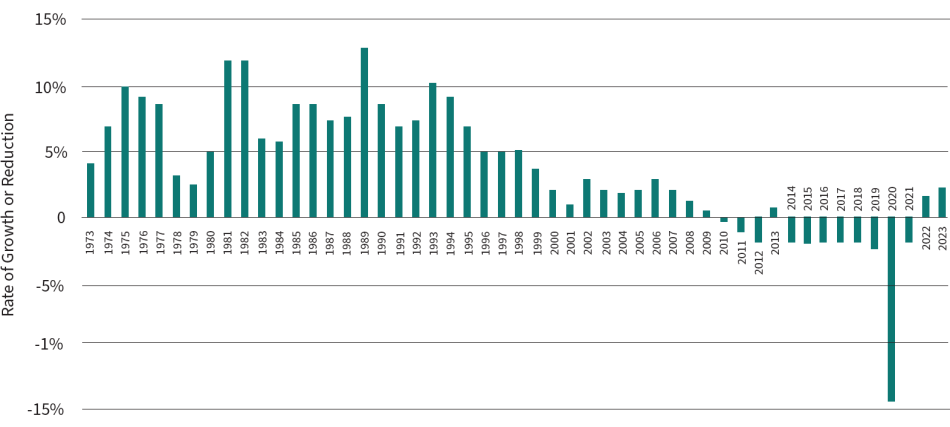
Source: Bureau of Justice Statistics. (1982). Prisoners 1925-81; Bureau of Justice Statistics Corrections Statistical Analysis Tool; Mueller, D., & Kluckow, R. (2023). Prisoners in 2023–Statistical tables. Bureau of Justice Statistics.
Rapid Buildup, Modest Decline, and Rollbacks
During the buildup of mass incarceration, between 1972 and 2009, the prison population grew an average of 5.8% annually. Since then, the pace of decarceration has been less than one third the rate of growth—averaging 1.7% each year, which includes an anomalous 14% drop in 2020 in response to the COVID-19 pandemic, and increases in the prison population in 2013, 2022, and 2023.10 The recent decarceration trajectory is tenuous given that the U.S. prison population grew by 4.0% between 2021 and 2023.11
The recent upticks in imprisonment levels follow eight consecutive years of decarceration. If the country were to course correct and resume decarceration at its recent pace of downsizing—averaging 1.7% annually since 2009—it would take 105 years (until 2130) to return to 1972’s imprisonment level—a level that preceded the era of mass incarceration.12
Significant Variation Across States
Nationally, a return to 1972’s level of imprisonment would represent an 87% reduction in the prison population since the peak level in 2009. The U.S. youth justice system has already achieved reductions close to this magnitude: the number of youth held in juvenile justice facilities fell from a peak of 108,800 in 2000 to 27,600 in 2022, a 75% decline.13 Some states are well on their way to achieving this level of decarceration in adult prisons as well. Alaska, Connecticut, New Jersey, New York, and Vermont have reduced their prison populations over 50% since reaching peak levels.14 Twenty-one states and the federal prison system15 have reduced their prison populations by over 25% since reaching their peaks, outpacing the national average level of decarceration.
Along with recent prison population reductions, several states have seen significant declines in crime, sometimes outpacing nationwide crime trends.16 For example, between 1999 and 2023, when New York more than halved its prison population, the state’s violent crime rate fell by 34% while the U.S. violent crime rate fell by 28%.17 Decarceration has also helped New York and several other states close, and in some cases repurpose, correctional facilities.18
Yet dangerous overcrowding persists in many jurisdictions and some policymakers plan to further expand incarceration levels. Alabama, a state with a still-bloated prison system rife with serious constitutional violations, is expected to grow its prison population by almost a third in the next five years, and has begun on a new billion dollar mega prison.19 Prompted by its governor, in 2019 Alaska’s state legislature repealed several aspects of a major criminal justice overhaul, Senate Bill 91.20 In 2022, Tennessee legislators expanded the state’s “truth in sentencing” law, requiring some individuals to serve 100% of their sentences.21
Given the dire consequences of mass incarceration and the breadth of evidence of its limited, and sometimes counterproductive, impact on public safety, the pace of decarceration has been far too slow in many states, and several jurisdictions have turned in the wrong direction. Ten states have reduced their prison populations by less than 15%.22 An additional five states reached their peak level of imprisonment in 2023: Arkansas, Idaho, Montana, Nebraska, and North Dakota.
Figure 2. Historical and Projected U.S. State and Federal Prison Population, Based on 2009-2023 Rate of Decline
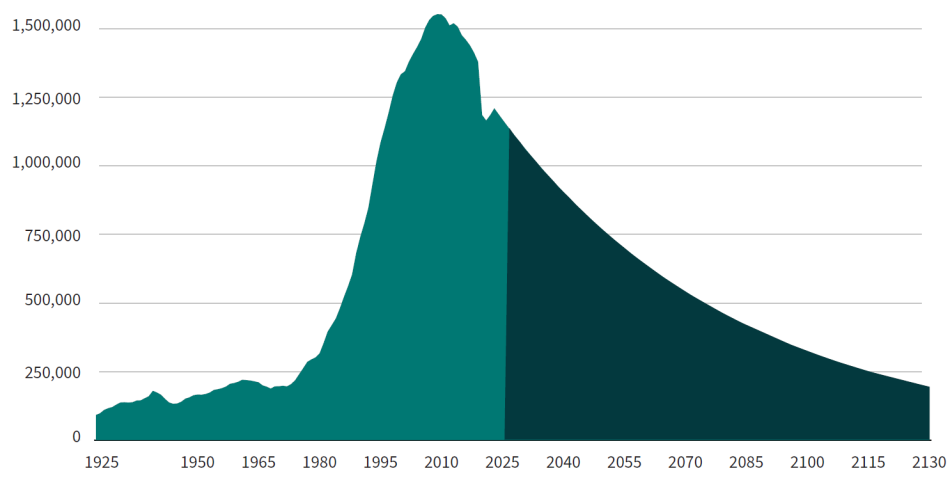
Source of historical figures: Bureau of Justice Statistics. (1982). Prisoners 1925-81; Bureau of Justice Statistics Corrections Statistical Analysis Tool; Mueller, D., & Kluckow, R. (2023). Prisoners in 2023–Statistical tables. Bureau of Justice Statistics.
Figure 3. U.S. Prison Population Trends Through 2023: Decreases Since Peak Year, Increases Since 2018
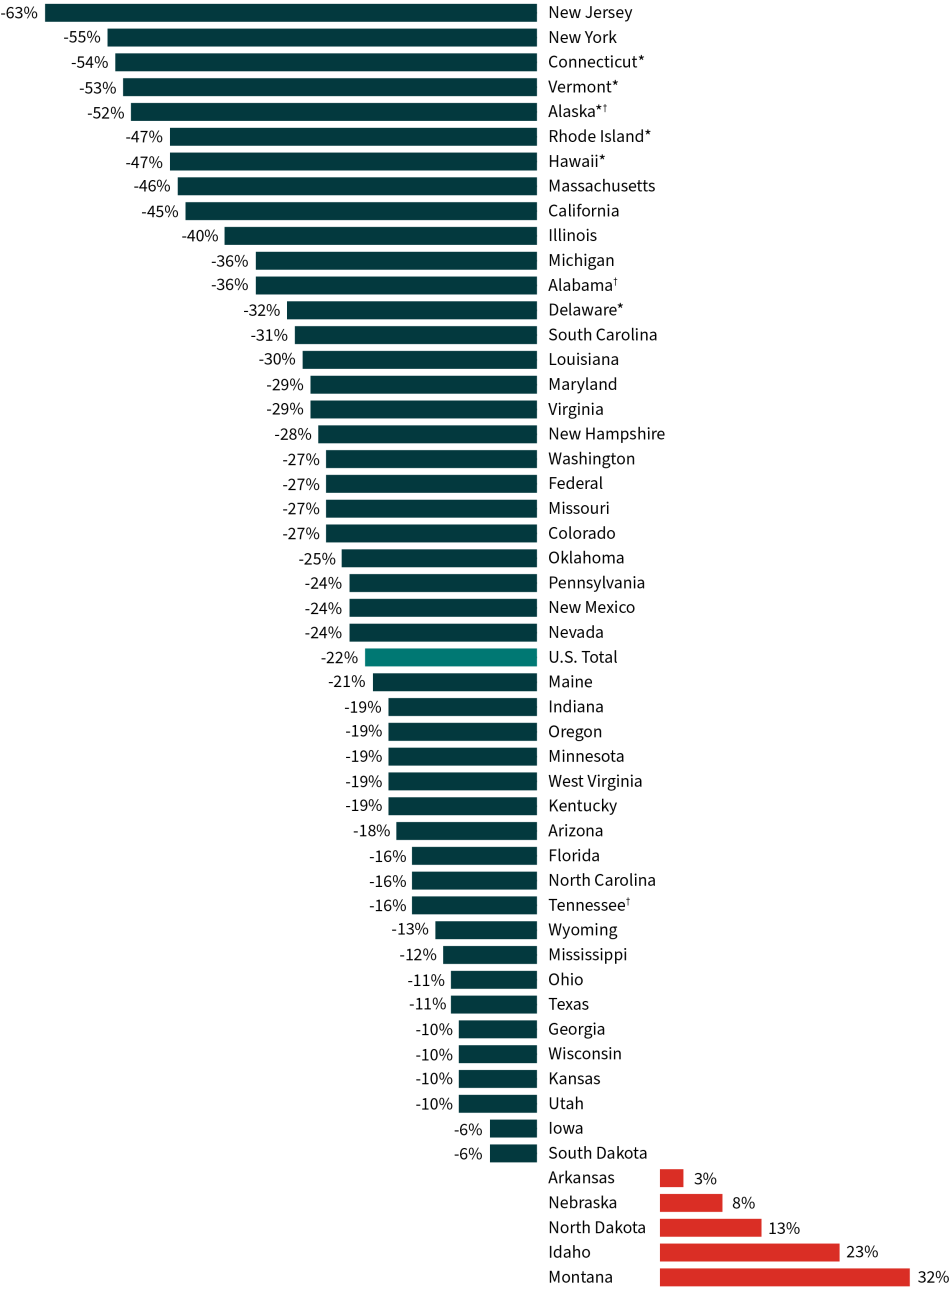
Note: See Table 1 for additional details.
* Data include jail populations because prisons and jails are an integrated system in these states.
† These states are poised to reverse some of this progress. See page 4 for more details.
Source: Bureau of Justice Statistics Prisoners Series (1999-2023)
Meaningful Decarceration Requires Reforms for Extreme Sentences
The United States has made only modest progress toward ending mass incarceration amidst a historic crime drop. By year end 2024, violent crime rates reported to the police had plummeted to half of their 1990s levels, and property crime rates fell even further—just as crime rates have fallen in many other countries that did not increase imprisonment levels.23 But U.S. imprisonment levels continued to increase for nearly two decades while crime rates fell, and the modest level of decarceration since appears to be in jeopardy.
In 2020, amidst the COVID-19 pandemic, violent crime rates increased—with homicides spiking—while property crimes continued their decline.24 The most recently available data shows that homicide rates are below their pre-pandemic level and the overall violent and property crime rates are at historic lows.25
Past reforms have reduced the number of people imprisoned for a drug offense by 46% between peak year 2007 and 2022 (the most recent year of this data). The number of people imprisoned for a property offense has declined 50% between peak year 2007 and 2022. But for the majority (56%) of the prison population imprisoned for a violent crime—which generally ranges from robbery and assault to rape and murder—sentencing relief remains elusive.26 Overall, the number of people imprisoned for a violent offense has declined by only 11% between peak year 2009 and 2022, despite violent crimes falling by 50% between peak year 1991 and 2022.27 Longer prison terms have prevented this segment of the prison population from contracting amidst the historic crime drop.28
A key driver of mass incarceration has been the dramatic growth in length of imprisonment, including the unprecedented growth in life imprisonment. One in six people in U.S. prisons is serving a life sentence (16% of the prison population).29 The reluctance to scale back extreme sentences is at odds with evidence that long sentences incapacitate older people who pose little public safety threat, produce limited deterrent effects, and detract from more effective investments in public safety.30 Ending mass incarceration will require moderating prison terms for violence as well as minimizing imprisonment and prison terms for non-violent crimes.
Figure 4. Reported Violent Crimes, 1985-2024
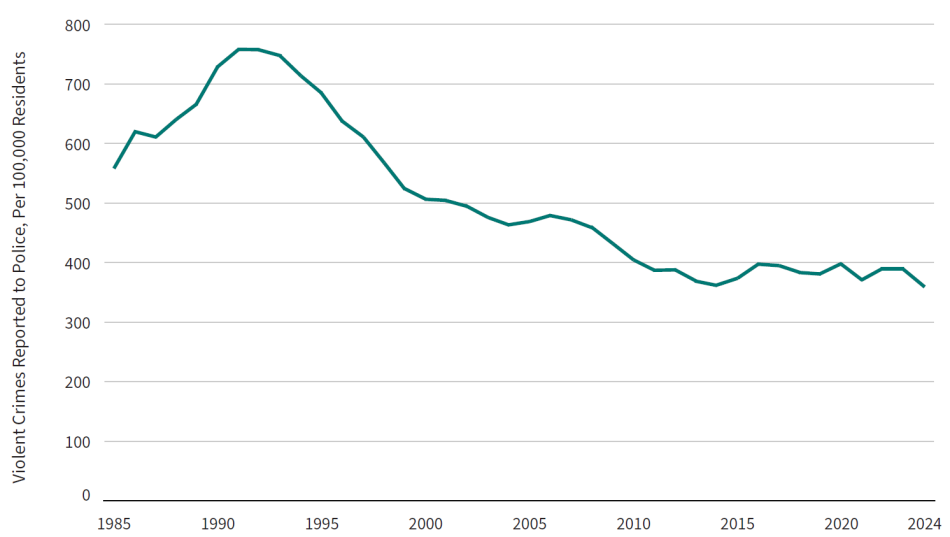
Source: Federal Bureau of Investigation. (2025). Crime data explorer.
Figure 5. U.S Prison Population by Conviction Offense, 1980-2022
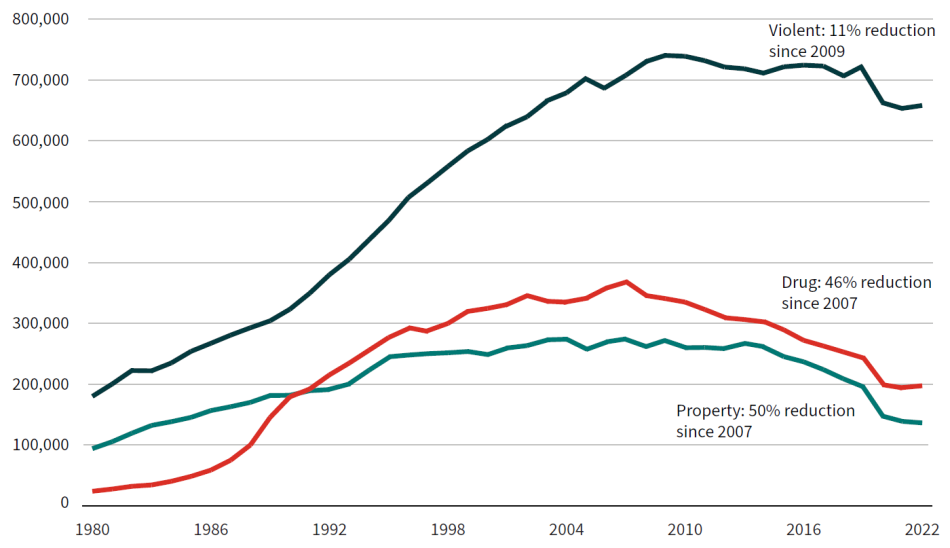
Note: Reductions are from years when the prison population for that offense category reached its peak. Chart omits public order and other/unspecified offenses, for which an additional 192,000 people were imprisoned in 2022, a 22% reduction from 2018 when that population reached its peak. Source: Snell, T. L. (1995). Correctional populations in the United States, 1993. Bureau of Justice Statistics; Bureau of Justice Statistics Prisoners Series (1996-2023).
| Jurisdiction | Peak to 2023 | Peak Year |
|---|---|---|
| New Jersey | -62.9% | 1999 |
| New York | -55.3% | 1999 |
| Connecticut* | -53.9% | 2007 |
| Vermont* | -53.5% | 2009 |
| Alaska*† | -52.3% | 2006 |
| Rhode Island* | -46.9% | 2008 |
| Hawaii* | -46.7% | 2005 |
| Massachusetts | -45.8% | 2011 |
| California | -44.9% | 2006 |
| Illinois | -39.6% | 2012 |
| Michigan | -36.0% | 2006 |
| Alabama† | -35.8% | 2012 |
| Delaware* | -31.9% | 2007 |
| South Carolina | -30.9% | 2009 |
| Louisiana | -29.8% | 2012 |
| Maryland | -29.1% | 2007 |
| Virginia | -28.5% | 2015 |
| New Hampshire | -27.8% | 2007 |
| Washington | -27.3% | 2017 |
| Federal | -27.3% | 2011 |
| Missouri | -26.7% | 2017 |
| Colorado | -26.6% | 2008 |
| Oklahoma | -24.8% | 2016 |
| Pennsylvania | -24.4% | 2011 |
| New Mexico | -23.8% | 2017 |
| Nevada | -23.8% | 2017 |
| U.S. total | -22.1% | 2009 |
| Maine | -20.5% | 2007 |
| Indiana | -19.4% | 2013 |
| Oregon | -19.3% | 2018 |
| Minnesota | -19.2% | 2015 |
| West Virginia | -19.0% | 2016 |
| Kentucky | -18.6% | 2017 |
| Arizona | -18.3% | 2015 |
| Florida | -16.4% | 2010 |
| North Carolina | -16.1% | 2014 |
| Tennessee† | -15.8% | 2017 |
| Wyoming | -13.0% | 2018 |
| Mississippi | -11.6% | 2008 |
| Ohio | -10.9% | 2015 |
| Texas | -10.8% | 2010 |
| Georgia | -10.3% | 2009 |
| Wisconsin | -10.1% | 2018 |
| Kansas | -9.8% | 2019 |
| Utah | -9.5% | 2013 |
| Iowa | -6.3% | 2018 |
| South Dakota | -5.5% | 2017 |
| Jurisdiction | 2018 to 2023 | Peak Year |
|---|---|---|
| Arkansas | 3.1% | 2023 |
| Nebraska | 8.2% | 2023 |
| North Dakota | 13.1% | 2023 |
| Idaho | 23.2% | 2023 |
| Montana | 32.4% | 2023 |
Source: Bureau of Justice Statistics Prisoners Series (1999-2023)
* Data include jail populations because prisons and jails are an integrated system in these states.
† These states are poised to reverse some of this progress. See page 4 for more details.
| 1. | World Prison Brief. (2023). Highest to lowest – Prison population total. Retrieved October 6, 2025, from https://www.prisonstudies.org/highest-to-lowest/prison-population-total. |
|---|---|
| 2. | Bureau of Justice Statistics. (1982). Prisoners 1925-81; Bureau of Justice Statistics Corrections Statistical Analysis Tool; Mueller, D., & Kluckow, R. (2023). Prisoners in 2023–Statistical tables. Bureau of Justice Statistics. |
| 3. | Federal Bureau of Investigation. (2025). Crime data explorer. |
| 4. | Mueller, D., & Kluckow, R. (2023). Prisoners in 2023–Statistical tables. Bureau of Justice Statistics. |
| 5. | The prison population grew 4.0% between 2021 and 2023. By 2023, the U.S. prison population had declined 22% since reaching its peak in 2009. Mueller, D., & Kluckow, R. (2023). Prisoners in 2023–Statistical tables. Bureau of Justice Statistics. |
| 6. | Federal Bureau of Investigation. (2025). Crime data explorer. |
| 7. | See for example: Flynn, M., & Gathright, J. (2025, September 5). House GOP weighing bills to remove elected D.C. AG, overhaul justice policies. Washington Post; Solomon, A. L. (2025). DOJ funding update: A deeper look at the cuts. Council on Criminal Justice; McKinley, J., Ashford, G., & Hurubie, M. (2023, April 28). New York will toughen contentious bail law to give judges more discretion. New York Times. |
| 8. | Ghandnoosh, N. (2023). One in five: Ending racial inequity in incarceration. The Sentencing Project; Komar, L., & Porter, N. D. (2023). Safety beyond sentencing. The Sentencing Project; John Jay College Research Advisory Group on Preventing and Reducing Community Violence. (2020). Reducing violence without police: A review of the research evidence. John Jay College of Criminal Justice; Sebastian, T., et al. (2022) A new community safety blueprint: How the federal government can address violence and harm through a public health approach. Brookings; Doleac, J. (2018). New evidence that access to health care reduces crime. Brookings. |
| 9. | Petrich, D. M., et al. (2021) Custodial sanctions and reoffending: A meta-analytic review. Crime and Justice (50). https://doi.org/10.1086/715100; Blumstein, A., & Piquero, A. (2007). Restore rationality to sentencing policy. Criminology & Public Policy, 6(4), 679-687. https://doi.org/10.1111/j.1745-9133.2007.00463.x; Kazemian, L., & Farrington, D. P. (2018). Advancing knowledge about residual criminal careers: A follow-up to age 56 from the Cambridge Study in Delinquent Development. Journal of Criminal Justice, 57, 1-10. https://doi.org/10.1016/j.jcrimjus.2018.03.001; Piquero, A., Hawkins, J., & Kazemian, L. (2012). Criminal career patterns. In R. Loeber & D. P. Farrington (Eds.), From juvenile delinquency to adult crime: Criminal careers, justice policy, and prevention (pp. 14–46). New York, NY: Oxford University Press. |
| 10. | While the 2020 reductions were substantial, they were insufficient against the threat that the pandemic posed to incarcerated individuals. Franco-Paredes, C., et al. (2020). Decarceration and community re-entry in the COVID-19 era. Lancet Infectious Diseases, 21(1), 11-16. https://doi.org/10.1016/S1473-3099(20)30730-1 |
| 11. | Mueller, D., & Kluckow, R. (2023). Prisoners in 2023–Statistical tables. Bureau of Justice Statistics. |
| 12. | The U.S. prison population has grown far beyond the U.S. population, as reflected in imprisonment rates that account for total population size. The imprisonment rate grew from 93 per 100,000 residents in 1972 to 506 per 100,000 in 2008. It then declined by an average of 2.2% annually until 2023, reaching 360 per 100,000. At this rate, it would take 60 years—until 2085—to return to 1972’s imprisonment rate. See Figure 2 for source information. |
| 13. | Rovner, J. (2024). Youth justice by the numbers. The Sentencing Project. |
| 14. | Connecticut, Vermont, and Alaska have integrated jail and prison systems, as do Delaware, Hawaii, and Rhode Island. The population counts in this brief therefore include the jail populations of these states. |
| 15. | This figure is based on the number of people serving sentences longer than one year. The Bureau of Prisons reports that the total population under its jurisdiction decreased 29% between peak year 2013 and 2025. This followed a nearly 800% increase in the federal prison population since 1980. Federal Bureau of Prisons. (2023). Statistics – Population statistics. Retrieved October 6, 2025, from https://www.bop.gov/about/statistics/population_statistics.jsp |
| 16. | Schrantz, D., DeBor, S., & Mauer, M. (2018). Decarceration strategies: How 5 states achieved substantial prison population reductions. The Sentencing Project; Mauer, M. & Ghandnoosh, N. (2014). Fewer prisoners, less crime: A tale of three states. The Sentencing Project. |
| 17. | Federal Bureau of Investigation. (2025). Crime data explorer. |
| 18. | Porter, N. (2022). Repurposing correctional facilities to strengthen communities. The Sentencing Project. |
| 19. | Chapoco, R. (2025, September 29). Alabama state prison population could rise by a third by 2030. Alabama Reflector. https://alabamareflector.com/2025/09/29/alabama-state-prison-population-could-rise-by-a-third-by-2030/?utm_source=TMP-Newsletter&utm_campaign=adaab5bd49-EMAIL_CAMPAIGN_2025_09_30_10_44&utm_medium=email&utm_term=0_5e02cdad9d-adaab5bd49-174282833; Lyman, B. & Roney, M. (2021, October 1). Gov. Kay lvey signs $1.3 billion prison construction bill. Montgomery Advisor. https://www.montgomeryadvertiser.com/story/news/2021/10/01/alabama-senate-approves-1-3-billion-prison-construction-bill/5934851001/; U.S. Department of Justice. (2020, December 9). Justice Department files lawsuit against the state of Alabama for unconstitutional conditions in state’s prisons for men [Press release]. https://www.justice.gov/opa/pr/justice-department-files-lawsuit-against-state-alabama-unconstitutional-conditions-states |
| 20. | Brooks, J. (2019, May 28). Alaska Senate votes to repeal and replace most of SB 91, sending crime bill to governor’s desk. Anchorage Daily News. https://www.adn.com/politics/alaska-legislature/2019/05/29/alaska-senate-votes-to-repeal-and-replace-most-of-sb-91-sending-crime-bill-to-governors-desk/ |
| 21. | Brown, M. (2022, April 21). Tennessee General Assembly passes controversial ‘truth in sentencing’ legislation. The Tennessean. https://www.tennessean.com/story/news/politics/2022/04/21/tennessee-general-assembly-passes-controversial-truth-sentencing-legislation/7400115001/ |
| 22. | Georgia, Iowa, Kansas, Mississippi, Ohio, South Dakota, Texas, Utah, Wisconsin, and Wyoming. |
| 23. | The rate of reported violent crimes fell from 758 per 100,000 residents in 1991 to 359 in 2024 (53% decline); the rate of reported property crimes rate fell from 5,140 per 100,000 residents in 1991 to 1,760 in 2024 (66% decline). The homicide rate fell from a high of 9.8 per 100,000 residents in 1991 to 5.0 in 2024 (49% decline). Federal Bureau of Investigation. (2025). Crime data explorer; Doob, A., & Webster, C. (2006). Countering punitiveness: Understanding stability in Canada’s imprisonment. Law & Society Review, 40(2), 325–367. https://doi.org/10.1111/j.1540-5893.2006.00266.x; Tseloni, A., Mailley, J. & Garrell, G. (2010). Exploring the international decline in crime rates. European Journal of Criminology, 7(5), 375–394. https://doi.org/10.1177/1477370810367014. |
| 24. | The rate of reported violent crimes increased 5% in 2020 (increasing from 381 to 399 per 100,000 residents). The homicide rate increased 27% in 2020 (increasing from 5.1 to 6.5 per 100,000 residents), following a 2% increase in 2019. Reported rates of property crimes continued their decline in 2020 (falling 8%, from 2,131 to 1,958 per 100,000). Federal Bureau of Investigation. (2025). Crime data explorer. See also Grawert, A. and Kim, N. (2022). Myths and realities: Understanding recent trends in violent crime. Brennan Center. |
| 25. | Federal Bureau of Investigation. (2025). Crime data explorer; Asher, J. (2024, December 18). Crime in 2024: A historic drop in murder with declining violent and property crime. Jeff-alytics; Asher, J. (2025, September 22). The FBI will likely report the lowest murder rate ever recorded In 2025. Jeff-alytics; Lopez, E., & Boxerman, B. (2025). Crime trends in U.S. cities: Year-end 2024 update. Council on Criminal Justice. |
| 26. | Ghandnoosh, N. (2019). The next step: Ending excessive punishment for violent crimes. The Sentencing Project; Mueller, D., & Kluckow, R. (2023). Prisoners in 2023–Statistical tables. Bureau of Justice Statistics. |
| 27. | Federal Bureau of Investigation. (2025). Crime data explorer. |
| 28. | Ghandnoosh, N. & Nellis, A. (2022). How many people are spending over a decade in prison? The Sentencing Project. |
| 29. | Nellis, A. & Barry, C. (2025). A matter of life: The scope and impact of life and long term imprisonment in the United States. The Sentencing Project. |
| 30. | Ghandnoosh, N. & Nellis, A. (2022). How many people are spending over a decade in prison? The Sentencing Project. |

