Black Disparities in Youth Incarceration
Despite long-term declines in youth incarceration, Black youth remain vastly more likely to be incarcerated than their white peers. Black youth are almost five times as likely as their white peers to be held in juvenile facilities.
Related to: Youth Justice, Racial Justice
For a decade, incarceration disparities between Black and white youth have remained stubbornly high. As of 2021, Black youth were 4.7 times as likely to be placed (i.e., detained or committed) in juvenile facilities as their white peers, according to nationwide data collected in October 2021 and recently released. This disparity has hardly changed over the past decade.1
Juvenile facilities, including 1,323 detention centers, residential treatment centers, group homes, and youth prisons2 held 24,894 youths as of October 2021. (These data do not include the 291 people under 18 in adult prisons at year-end 20213 or the estimated 2,000 people under 18 in adult jails at midyear 2021.)4
Nationally, the youth placement rate was 74 per 100,000 in 2021. The Black youth placement rate was 228 per 100,000, compared to the white youth placement rate of 49 per 100,000.
Forty-two percent of youths in placement are Black, even though Black Americans comprise only 15% of all youth across the United States.5 Among all states with a population of at least 8,000 Black youth, (between 10 and 17), a cutoff that allows for meaningful comparisons, Black youth are more likely to be in custody than white youth. Black and white youth have similar juvenile placement rates in the District of Columbia.
Between 2011 and 2021, juvenile placements fell 59%. During this same period, racial disparities grew more than 10% in 19 states and decreased by at least 10% in 23 states and the District of Columbia.
- As of 2021, in Connecticut, New Jersey, Wisconsin, Massachusetts, and Illinois, African American youth were at least 10 times as likely to be held in placement as white youth.
- Between 2011 and 2021, Illinois, Connecticut and New Jersey saw their racial disparity at least double.
- During these same years, Minnesota, Arkansas, South Carolina, Pennsylvania, Rhode Island, and the District of Columbia decreased their racial disparities by at least one-third.
| State | Black Rate | White Rate | B/W Disparity |
|---|---|---|---|
| Alabama | 229 | 97 | 2.4 |
| Arizona | 252 | 41 | 6.1 |
| Arkansas | 179 | 66 | 2.7 |
| California | 242 | 32 | 7.6 |
| Colorado | 457 | 49 | 9.3 |
| Connecticut | 94 | 3 | 31.3 |
| Delaware | 433 | 52 | 8.3 |
| District of Columbia | 183 | 204 | 0.9 |
| Florida | 189 | 52 | 3.6 |
| Georgia | 151 | 33 | 4.6 |
| Illinois | 178 | 14 | 12.7 |
| Indiana | 278 | 93 | 3.0 |
| Iowa | 448 | 51 | 8.8 |
| Kansas | 535 | 63 | 8.5 |
| Kentucky | 325 | 33 | 9.8 |
| Louisiana | 305 | 55 | 5.5 |
| Maryland | 79 | 9 | 8.8 |
| Massachusetts | 137 | 10 | 13.7 |
| Michigan | 253 | 50 | 5.1 |
| Minnesota | 243 | 33 | 7.4 |
| Mississippi | 102 | 24 | 4.3 |
| Missouri | 358 | 71 | 5.0 |
| Nebraska | 483 | 51 | 9.5 |
| Nevada | 326 | 76 | 4.3 |
| New Jersey | 200 | 7 | 28.6 |
| New York | 151 | 18 | 8.4 |
| North Carolina | 102 | 16 | 6.4 |
| Ohio | 442 | 63 | 7.0 |
| Oklahoma | 325 | 46 | 7.1 |
| Oregon | 676 | 127 | 5.3 |
| Pennsylvania | 272 | 49 | 5.6 |
| Rhode Island | 243 | 63 | 3.9 |
| South Carolina | 131 | 54 | 2.4 |
| Tennessee | 129 | 24 | 5.4 |
| Texas | 262 | 60 | 4.4 |
| Utah | 212 | 23 | 9.2 |
| Virginia | 198 | 30 | 6.6 |
| Washington | 245 | 35 | 7.0 |
| West Virginia | 847 | 177 | 4.8 |
| Wisconsin | 497 | 34 | 14.6 |
| U.S. Total | 228 | 49 | 4.7 |
The table above and the figure below are limited to the 39 states and the District of Columbia with at least 8,000 Black residents between 10- and 17-years old. Numbers in the third column reveal the extent to which Black youth are incarcerated relative to white youth. For example, in Alabama, Black youth are 2.4 times as likely to be held in a juvenile facility as their white peers.
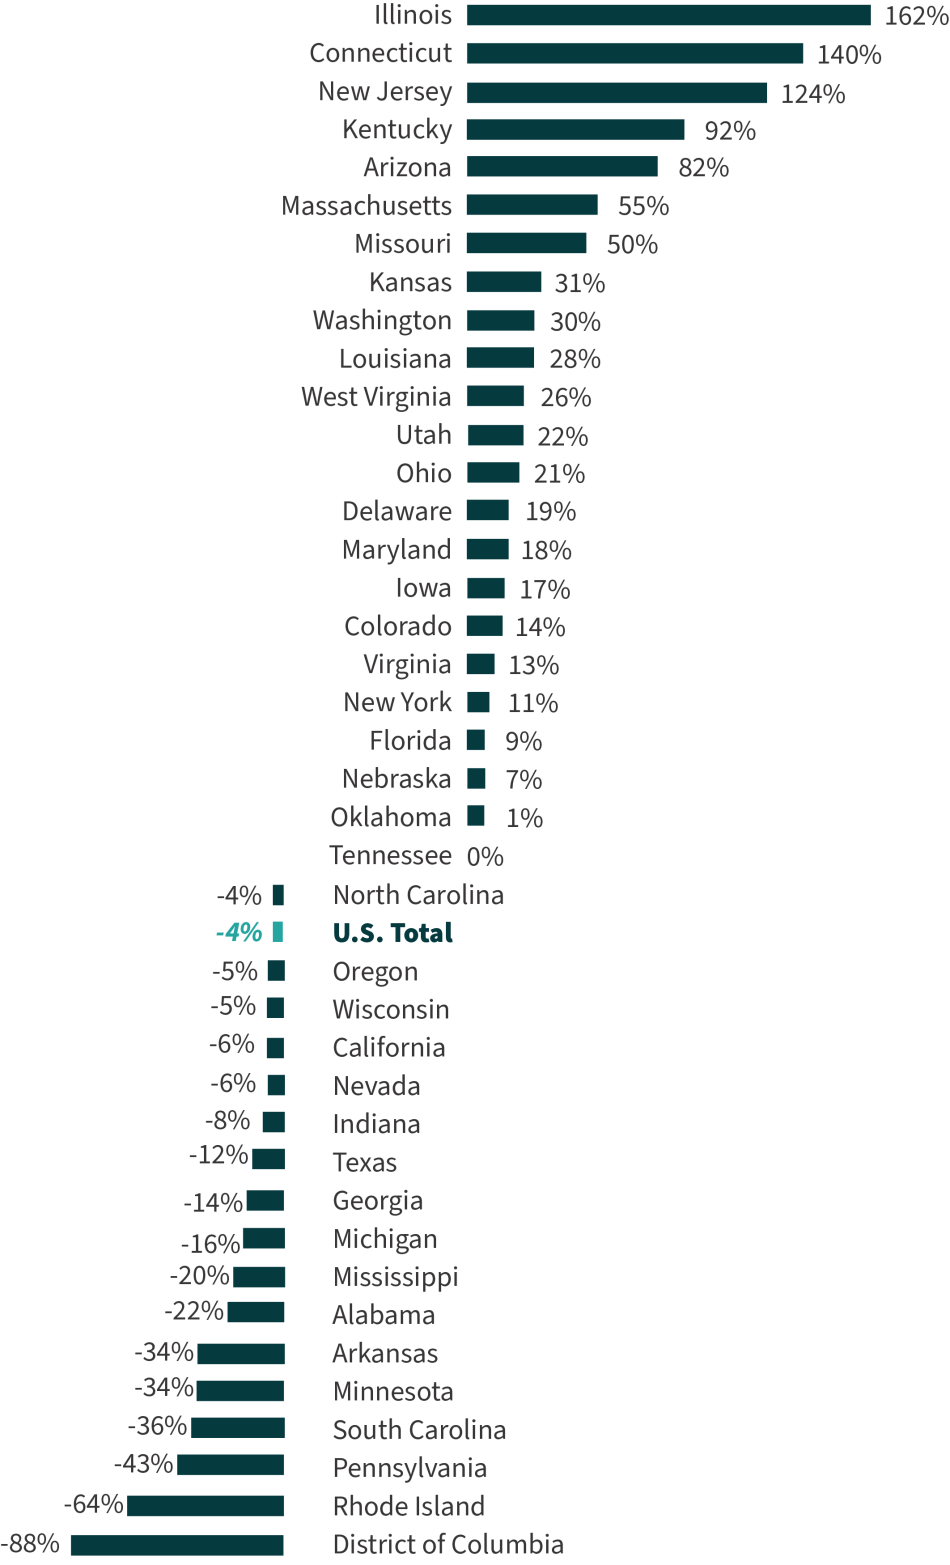
Change in Black/White Placement Disparity; 2011 vs. 2021
Positive numbers reveal an increase in the racial disparity between 2011 and 2021, and negative numbers reveal a decreased racial disparity.
| 1. | Puzzanchera, C., Sladky, T.J., and Kang, W. (2023). “Easy Access to the Census of Juveniles in Residential Placement.” Available: https://www.ojjdp.gov/ojstatbb/ezacjrp/ |
|---|---|
| 2. | Puzzanchera, C., Hockenberry, S., Sladky, T.J., and Kang, W. (2022). “Juvenile Residential Facility Census Databook.” Available: https://www.ojjdp.gov/ojstatbb/jrfcdb/ |
| 3. | Carson, E. A. (2022). Prisoners in 2021-Statistical Tables. Bureau of Justice Statistics. https://bjs.ojp.gov/sites/g/files/xyckuh236/files/media/document/p21st.pdf |
| 4. | Zeng, Z. (2022). Jail Inmates in 2021 – Statistical Tables. https://bjs.ojp.gov/sites/g/files/xyckuh236/files/media/document/p21st.pdf |
| 5. | Puzzanchera, C., Sladky, A. and Kang, W. (2021). “Easy Access to Juvenile Populations: 1990-2020.” Online. Available: https://www.ojjdp.gov/ojstatbb/ezapop |

